Earth receives its warmth from the sun. Because the world
rotates on an angle to its path around the sun, radiation is spread more
evenly and seasons are experienced worldwide.
Read what underwater photographers
need to know about light in the sea
and other physical properties.
The ocean's reservoir in resources seems inexhaustible, but is it?
This chapter looks at the ocean's capacity to feed humans and to recycle
their wastes.
The
temperature of the surface of the Earth, the atmosphere, depends on a delicate
balance between solar radiation from the sun and the Earth radiating it
out back into space. Only a very small amount percolates up through the
crust from the Earth's hot core. As the Earth rotates around its axis,
day and night occur. Its once a year rotation around the sun would have
been unnoticeable if the Earth's axis of rotation had not been tilted.
Its tilt of 23.5 degrees, creates the seasons, which means, that every
place on Earth experiences at least once a year, a period of intense sunlight,
bright enough for life to blossom.
Although the path of the Earth around the sun is almost perfectly circular,
it stands closest to the sun in the June solstice, the northern summer.
Being 1.7% closer, lands 3.4% more sunlight on the outer atmosphere, which
is a noticeable amount in the radiation balance. But it is not only this
that makes the northern summers warmer.
Because
the Northern Hemisphere is dominated by land and the Southern Hemisphere
by sea, temperature differences between summer and winter are more extreme
in the Northern Hemisphere (the land warms and cools more quickly than
the ocean). In the diagram, average land and sea temperatures are shown
for each place on Earth, from the North Pole (left) to the South Pole (right).
New Zealand is located around 40º S, in the temperate climate zone,
where land temperatures change about as much as sea temperatures. For our
antipodes at the other side of the globe, the situation is much different.
They experience hotter summers and colder winters.
The temperate regions experience the largest seawater temperature changes
and New Zealand is no exception. Notice that the difference between winter
and summer, about 6-8ºC, amounts to shifting our country by 10-12º
North-South for summer-winter. Note also that polar sea water has practically
no temperature change, due to the stabilising effect of the ice.
As
this diagram shows, the tilt of the Earth has a profound effect on the
amount of sunshine falling on its surface. In the tropics, seasonal variation
is hardly noticeable (14%, twice yearly) but in temperate climates like
New Zealand, the summer brings three times more sunlight (arising from
both duration and intensity), than winter. For the poles, the difference
is of course extreme, due to the polar night. Ironically, the amount of
sunlight experienced in the polar summer, exceeds that in the tropics,
due to the 24 hour polar summer day. For sea life, these curves are very
important.
Also on a daily basis, as we all know, the sunlight changes strength
as we pass from night to day and into night again. The curve on the right
shows the theoretical decline of sunlight intensity, depending on the sun's
angle from vertical. Notice how steeply it drops off towards sunset/sunrise.
By 7:30 AM and 4:30 PM (assuming 12 hours daylight), the sun has reached
half strength. New Zealand is located roughly at 40ºS. Thus the sun's
angle varies from 40 + 23.5 =63º in summer to 40 - 23.5 = 17º
in winter, measured from direct overhead. This corresponds to about 40%
variation in light intensity..
Compared
to air, water has an extremely high heat capacity, so it takes much more
sunlight to warm up. Fortunately, warm sea water is lighter than cool sea
water, so the warmed water stays on top and is reluctant to pass its heat
downward. As a result, the sea warms slowly but cools more quickly. During
the summers a thermocline develops between the warm surface water and the
cooler bottom water. As the sea warms further, this sharp boundary moves
deeper. In New Zealand, the thermocline may descend to 15m. Sometimes a
second thermocline is found at 40m depth, originating from the continental
shelf. Towards winter, as the surface water cools, the thermoclines disappear.
Also during heavy storms, the sea water may get mixed so thoroughly, that
thermoclines disappear. The density of water does not only depend on temperature,
but also on salinity and pressure, discussed in next chapter on physical
properties and in currents.
The deep sea has a temperature of -1ºC.
Why are the middle of winter and summer
experienced later than the sun/earth solstices? Anyone living in temperate climates, knows that the worst of winter
is not over when the days start to lengthen again. The sun's winter solstice
(in the north) is around 23 December, but winter has hardly begun and will
be felt for at least another three months. Why this delay? It is hard to
understand that, as the earth is warmed more, it is still cooling more.
There is obviously some kind of inertia at work, but how?
The earth's surface temperature is in a sensitive balance between incoming
and outgoing radiation. After the winter solstice, the incoming radiation
is undeniably increasing.
The temperature at any one place on earth does not only depend on the above,
but also on the temperature of surrounding land and sea.
Ice formation is a slow and energy-absorbing process, that slows down cooling.
Likewise, melting is slow and hinders the warming up. So, once ice has
formed, or the temperature passes 0 ºC, the surface temperature lags
considerably.
Ice and snow bounce back the sunlight, so that the increased solar radiation
does not result in more warming.
Compared to earth and air, water is slow to warm or to cool. Water masses
moderate temperature fluctuations.
Warm water lies on the surface of lakes and seas. Heat is slow to penetrate
to deeper layers, but cold water sinks easily to deeper waters. So, bodies
of water absorb less energy when warming up, but absorb more cold when
cooling off (release heat easily).
Once a body of water starts to freeze over, it absorbs cold more slowly,
so its moderating effect becomes much less.
Water takes a long time and energy to evaporate. So, summer won't begin
until (almost) all the winter's rain water has evaporated.
For Sea Surface Temperature (SST) images, visit the AVHRR
home page at the John Hopkins University and NOAA/NASA AVHRR Oceans
Pathfinder Monthly
Sea Surface Temperature page which also provides background information.
The TRMM home page in Japan has many global temperature and other maps.
Chemical properties
The main chemical constituent of seawater is salt (NaCl), a very
simple chemical compound, that is found in the tissues of all living organisms.
The oceans encompass about 5 billion cubic kilometre, or 5E21 kg. About
3.5% of that is salt, an unimaginable amount. It was thought that the salt
in the oceans has accumulated over the 3 billion years or so, that rivers
flowed into it, carrying dissolved salts from soil erosion, but if this
was so, the oceans would have been far saltier than they are. So, simultaneous
with the salt entering the sea, there must be an equal amount of salt leaving
the sea. The mechanism for doing so, is not known, but salt may have been
subducted under the continents, by tectonic movements. There it reforms
with other salts into rock crystals.
Principal constituents
of seawater At salinity = 34.7
Name of constituent Chloride as NaCl
Sodium Na
Magnesium
Mg
Sulphate
SO4
Calcium
Ca
Potassium
K
Carbon
C
Bromine Br
Boron B
Strontium Sr
Fluorine F
Nitrogen
ions
When the first organisms formed in the archaean sea, they did not have
cell membranes. The whole sea acted as their bodies. Later organisms did
develop membranes and were able to retain their body salts within. As the
chemistry of the sea changed, the organisms developed abilities to extract
salts and liquids from their environment and to maintain the liquids inside
their bodies at constant concentrations. It seems as if every living organism
today, carries inside it a remnant of the archaean sea. It is not surprising
that the seawater elements marked blue in the above table, are essential
to all life on earth. See also the periodic
table and table of essential
elements for plants, micro organisms and animals at the end of it.
When plants started to live on the land, not only did they have to
maintain their body fluids against the odds of drying out, but they also
had to acquire the ability to scavenge nutrients from nutrient-poor
soils, and to accumulate these into their tissues. Animals did not need
this capability, because they ate the plants (herbivores) or other animals
(carnivores).
See also the table of the abundance of chemical
elements for life, detailing the most abundant elements in the universe,
our solar system, Earth, the ocean, plants, animals and so on.
Physical properties
The sea is a strange world to live in, mainly because its physical qualities
are so different from the land world. The water conducts and stores heat
so well, that it is impossible to breathe water and be warm blooded at
the same time (dolphins breathe air). Water is 800 times denser than air,
so shapes that are successful on land, will fail in the sea. One needs
to be streamlined there and use the water to propel oneself. One needs
to be able to live in a medium that contains oxygen for breathing, waste
products from living, disease organisms, pests, other organisms that can
be caught and eaten, a medium that during storms tries to destroy you,
and so on. For more discussion, read the introduction to habitats
and biodiversity/marine.
Water has a profound effect on light, limiting marine plant life to
the top 20-50 metres and planktonic life to 100m depth. Underwater photographers
have to understand how light diminishes with depth. Read in the water-and-light
chapter about underwater photography, everything you need to know.
One of the most important physical properties of sea water is its weight
or density. The density of fresh water depends mainly on temperature: warm
water floating on top of cold water. But salt water's density depends also
on the amount of salt in it. The combination of temperature and saltiness
(salinity) has profound effects on the circulation of the oceans. Water
density also depends on the amount of pressure, since pressure compresses
water slightly, making it heavier. For studying how sound reflects off
deep water layers, the pressure effect is relevant, but not for water circulation.
The table on right shows how salt water compresses with depth. It is interesting
to note that the ocean (average depth 4000m) would stand 36m higher if
water were truly incompressible. (at 4000m, water is compressed
by about 1.8%, averaging 0.9% for the whole water column, or about 36m.)
Seawater density from compression
Depth 0 m
1000
2000
4000
6000
8000
10000
Density 1.02813
1.03285
1.03747
1.04640
1.05495
1.06315
1.07104
As
can be seen from this world map, the salinity of the oceans varies between
30 and 37 (3.0 and 3.7%). In regions with high evaporation, the seawater
becomes saltier, whereas salinity drops in the cooler regions, due to melting
ice masses. Normal seawater has about 35 gram of dissolved salt per litre
(leaving 965 gram of water), which makes it 24 g denser at 20ºC (see
table below). You can make saltwater by adding 35 gram of sea salt to a
litre of water. Swimmers notice that it is easier to swim in the sea than
in fresh water, because they float better. An 80 kg person displaces about
80 litre of water. Each displaced litre is 24 gram heavier and provides
as much extra flotation. In total: 80 x 24 gram = 1920 g = 2 kg! The sea
water provides 2 kg more flotation. Divers know this, and they adjust their
weight belts accordingly.
Rather than mentioning the whole number 1.024 for density, scientists
abbreviate it to two digits (24.0, e.g.), and call it sigma (the
Greek name for the letter s). They also spell it the Greek way,
which we cannot do here, so we will call density sigma, by its full
name, or just density.
As can be expected, the density of seawater depends
more on salinity than on temperature (see table). The density of sea water
is also more sensitive to temperature than that of fresh water. Note the
density maximum of 4.01 at 5º and salinity 5 (0.5%). (Actually 4.04
at 3ºC for 0.5% salinity) and a similar value for fresh water at 4.0ºC.
This density maximum disappears for ocean water.
Roughly speaking, cold fresh water (0º) is about 0.2% heavier than
warm fresh water (20º). Cold seawater is about 0.7% heavier than warm
seawater. Cold sea water is about 2.4% heavier than both cold or warm fresh
water.
How density affects ocean circulation, is discussed in the chapter about
currents.
Density values of seawater Vertical: temperature ºC.
Horizontal: salinity.
0 º 5 º 10 º 15 º 20 º 25 º 30 º
Sal 5 3.97
4.01
3.67
3.01
2.07
0.87
-0.57
Sal 10 8.01
7.97
7.56
6.85
5.86
4.62
3.15
Sal 20 16.07
15.86
15.32
14.50
13.42
12.10
10.57
Sal 30 24.10
23.74
23.08
22.15
20.98
19.60
18.01
Sal 35 28.13
27.70
26.97
25.99
24.78
23.36
21.75
Productivity
Productivity
on land depends on how well plants are growing. Plants need moisture, nutrients,
carbon dioxide, sunlight and warmth. Depending on the reliable availability
of these, plants will be more or less productive. Of the five requirements
mentioned, moisture comes number one, with sunlight and thus warmth next.
Although carbon dioxide is equally available all over the world, plants
compete for this resource so fiercely that it limits the growth of most
plants. Some plants do better than others in scavenging carbondioxide from
the air. Since the nutrients in soils are reasonably well spread over the
continents, these are not of prime consideration.
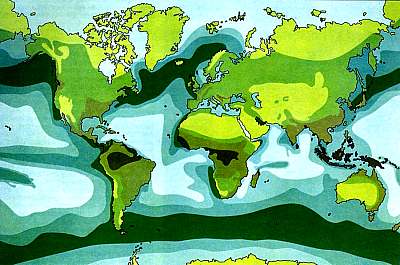
The map on right, shows the productivities of both the land and the
sea. Note that the colour scale for the land runs in four steps from 0
to 1000 gram carbon per square metre per year, but the scale for the ocean
runs from 0 to 400. Per square metre, the oceans are thus less productive,
but their area is nearly four times larger. Part of the reason for
this, is that the sea water absorbs more light and that seas are not very
much warmer during their productive summer seasons.
(Map courtesy of Atlas of the Oceans, 1977, Mitchell
Beazley Publ)
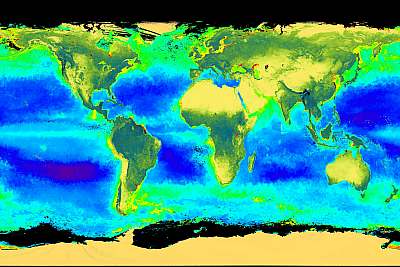
A
number of orbiting satellites, all in orbits crossing the poles, now record
sea surface temperature and chlorophyll and a number of other parameters,
around the clock. Here is a map of actual chlorophyll levels measured in
September 1998 (northern autumn). September is the autumn month for the
northern hemisphere but the spring month for the southern hemisphere. The
sun then stands above the equator (equinox = equal night, equal
night and day). Compare this map to the one above. When all seasons are
combined, the two maps start to look alike.
Notice how the temperate seas of the north have had their sunshine,
resulting in a wide band of chlorophyll, whereas the southern oceans are
just starting to bloom. Also very clearly, the areas of upwellings can
be seen: along the west coasts of all continents and around Antarctica.
The deep blue areas in the sea compare to the yellow areas on land, the
deserts.
Note also how the amount of chlorophyll has always been equated with
productivity, which is not always true. The tropical rain forests for instance,
have much green foliage and turnover, but their overall productivity is
low. One of the latest observations in the sea is that areas rich in chlorophyll
may in fact be eutrophicated (overnourished) and detrimental to life. Scientists
have measured a reduction in zooplankton in seas with increased levels
of chlorophyll. See also our most recent discoveries about degradation.
(Picture courtesy of NASA SEAWIFS programme)
In
the early part of this century, Russian scientists discovered that plant
life depends mainly on evapotranspiration, the rate of water transport
from roots to leaves and out to the atmosphere. Evapotranspiration depends
mainly on temperature and the availability of water, the two qualities
along the horizontal and vertical axes of this diagram which plots the
world's vegetation. Each of the vegetation classes also has its own soil
type, rate of metabolism and standing stock (biomass). Note that the amount
of sunshine depends on how cloudy the sky is, which limits growth in places
with excessive rainfall. Notice also that high stands of vegetation limit
the amount of sunlight falling on lower tiers.
In the table on right, the various types
of vegetation are compared with regions in the sea, and with human cultivation
of the soil. Notice that the forests of the world are highly productive,
and have a high biomass. Estuaries in the sea compare favourably with them.
Although upwelling zones in the ocean are highly productive, their total
area is only 1.5% of the continental shelf area. Note that the standing
stock in biomass is very low in the ocean, even where productivity is high.
Oceans thus turn over rather than accrue. Human cultivation compares favourably
with that of the forests (because it is done on deforested soils), but
its biomass varies enormously (grazing to rubber plantations).
Plants in the sea have the same five requirements as land plants but
moisture is always available. Plant plankton and algae do not evapo-transpire
and their productivity depends mainly on the availability of nutrients.
Sunlight and warmth depend on the height of the sun and much less on climate,
but the ocean's main limitation is the availability of nutrients, particularly
phosphorus, nitrogen and some trace elements (silica and iron). That is
why the map shows high levels of productivity near the shores. Here the
erosion of the land brings minerals and nutrients toward the coastal water.
The continental shelves running somewhat parallel to the coast, are the
most productive zones because they recycle nutrients easily and can be
bottom-trawled.
The plant plankton organisms (phytoplankton)
are the main producers in the oceans. The plankton community forms an almost
closed ecosystem, but loses nutrients as dead organisms sink towards the
deep sea bottom. It causes vast unproductive areas in the open oceans.
Whereas forests are able to accumulate living matter in their leaves, stems
and soils, the ocean is unable to do so. Thus ocean meadows are turn-over
systems rather than stocking systems. Grasslands are also turnover systems,
providing food for a large stocking density of grazers.
A number of anomalies are immediately visible. In a band around Antarctica,
an area where the water is cold and where sunshine is absent for nearly
half a year each year, high primary productivity is found. This is because
deep ocean water, rich in nutrients, is able to surface here, due to special
temperature and salinity conditions. (See the chapter on currents).
A dark band of oceanic productivity runs along with the Gulf Stream
in the northern Atlantic and a similar band is found in the north Pacific.
These are also places of deepwater upwellings, the places where whaling
is done .
Very highly productive upwellings are also found on the west coast
of South America and Africa, near the Canary Islands, off Somalia and around
Japan. These together, provide the bulk of the world's fish catches. See
also the chapters on plankton
and fishing.
In
this map, the original vegetation of the world is shown, before humans
started to farm it extensively. Note how productivity on the land is largely
dependent on climate and how very large areas of the continents are covered
in either desert or tundra and ice. Compare this map with the previous
ones and notice the kinds of vegetation that are the most productive. Note
that vegetation maps from various authors do not show exactly identical
boundaries, perhaps because these are difficult to define. For more information
about terrestrial ecosystems, their soils and productivity, visit soil/geology.
For actual and real-time maps of chlorophyll concentrations on land
and in the sea, visit Nasa's SEAWIFS
project.
The CNES (Centre Nationale
des Etudes Spatiales) has a very informative web site on their remote sensing
satellite SPOT, atmospheric theory and complete references to all other
remotes sensing satellites.
The table below shows ocean productivity for the three largest regions
in the world, excluding estuaries and mangroves. Because the open ocean
is so much larger than the coastal zone, its total productivity is estimatd
to be high. However, this figure may be misleading because of its low concentration
of plant life (typically 10-30 times less than coastal regions), which
makes fish like tuna difficult to catch (too few, too far between). The
open ocean may also turn out to be far more productive (2-5 times) than
estimated, due to the presence of mixotrophic zooplankton that live
in symbiosis with plant cells, thus requiring no phyto plankton for growth,
as they live primarily from sunlight and a mysterious dissolved organic
carbon in the sea, discovered by us (slush).
However, the catch statistics and trophic levels are accurate.
area
plant production million ton C/yr
trophic efficiency
trophic level harvested
fish production million ton/yr
value
open ocean
39900
10%
5 (tuna)
4.0
very high
coastal regions
8600
15%
4 (snapper)
29.0
high
upwelling regions
230
20%
2 (sardine)
46.0
low; pig/poultry
Note a trophic level indicates the number of steps in the food chain,
thus for tuna:
phytoplankton> zooplankton> fish larvae> bait fish> tuna, which is
five steps.
 The
temperature of the surface of the Earth, the atmosphere, depends on a delicate
balance between solar radiation from the sun and the Earth radiating it
out back into space. Only a very small amount percolates up through the
crust from the Earth's hot core. As the Earth rotates around its axis,
day and night occur. Its once a year rotation around the sun would have
been unnoticeable if the Earth's axis of rotation had not been tilted.
Its tilt of 23.5 degrees, creates the seasons, which means, that every
place on Earth experiences at least once a year, a period of intense sunlight,
bright enough for life to blossom.
The
temperature of the surface of the Earth, the atmosphere, depends on a delicate
balance between solar radiation from the sun and the Earth radiating it
out back into space. Only a very small amount percolates up through the
crust from the Earth's hot core. As the Earth rotates around its axis,
day and night occur. Its once a year rotation around the sun would have
been unnoticeable if the Earth's axis of rotation had not been tilted.
Its tilt of 23.5 degrees, creates the seasons, which means, that every
place on Earth experiences at least once a year, a period of intense sunlight,
bright enough for life to blossom.
 Because
the Northern Hemisphere is dominated by land and the Southern Hemisphere
by sea, temperature differences between summer and winter are more extreme
in the Northern Hemisphere (the land warms and cools more quickly than
the ocean). In the diagram, average land and sea temperatures are shown
for each place on Earth, from the North Pole (left) to the South Pole (right).
New Zealand is located around 40º S, in the temperate climate zone,
where land temperatures change about as much as sea temperatures. For our
antipodes at the other side of the globe, the situation is much different.
They experience hotter summers and colder winters.
Because
the Northern Hemisphere is dominated by land and the Southern Hemisphere
by sea, temperature differences between summer and winter are more extreme
in the Northern Hemisphere (the land warms and cools more quickly than
the ocean). In the diagram, average land and sea temperatures are shown
for each place on Earth, from the North Pole (left) to the South Pole (right).
New Zealand is located around 40º S, in the temperate climate zone,
where land temperatures change about as much as sea temperatures. For our
antipodes at the other side of the globe, the situation is much different.
They experience hotter summers and colder winters. As
this diagram shows, the tilt of the Earth has a profound effect on the
amount of sunshine falling on its surface. In the tropics, seasonal variation
is hardly noticeable (14%, twice yearly) but in temperate climates like
New Zealand, the summer brings three times more sunlight (arising from
both duration and intensity), than winter. For the poles, the difference
is of course extreme, due to the polar night. Ironically, the amount of
sunlight experienced in the polar summer, exceeds that in the tropics,
due to the 24 hour polar summer day. For sea life, these curves are very
important.
As
this diagram shows, the tilt of the Earth has a profound effect on the
amount of sunshine falling on its surface. In the tropics, seasonal variation
is hardly noticeable (14%, twice yearly) but in temperate climates like
New Zealand, the summer brings three times more sunlight (arising from
both duration and intensity), than winter. For the poles, the difference
is of course extreme, due to the polar night. Ironically, the amount of
sunlight experienced in the polar summer, exceeds that in the tropics,
due to the 24 hour polar summer day. For sea life, these curves are very
important.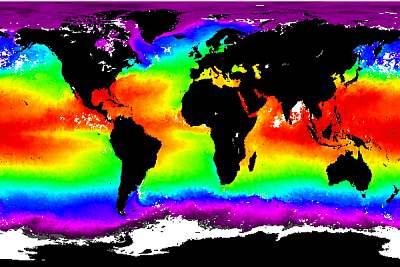 Compared
to air, water has an extremely high heat capacity, so it takes much more
sunlight to warm up. Fortunately, warm sea water is lighter than cool sea
water, so the warmed water stays on top and is reluctant to pass its heat
downward. As a result, the sea warms slowly but cools more quickly. During
the summers a thermocline develops between the warm surface water and the
cooler bottom water. As the sea warms further, this sharp boundary moves
deeper. In New Zealand, the thermocline may descend to 15m. Sometimes a
second thermocline is found at 40m depth, originating from the continental
shelf. Towards winter, as the surface water cools, the thermoclines disappear.
Also during heavy storms, the sea water may get mixed so thoroughly, that
thermoclines disappear. The density of water does not only depend on temperature,
but also on salinity and pressure, discussed in next chapter on physical
properties and in
Compared
to air, water has an extremely high heat capacity, so it takes much more
sunlight to warm up. Fortunately, warm sea water is lighter than cool sea
water, so the warmed water stays on top and is reluctant to pass its heat
downward. As a result, the sea warms slowly but cools more quickly. During
the summers a thermocline develops between the warm surface water and the
cooler bottom water. As the sea warms further, this sharp boundary moves
deeper. In New Zealand, the thermocline may descend to 15m. Sometimes a
second thermocline is found at 40m depth, originating from the continental
shelf. Towards winter, as the surface water cools, the thermoclines disappear.
Also during heavy storms, the sea water may get mixed so thoroughly, that
thermoclines disappear. The density of water does not only depend on temperature,
but also on salinity and pressure, discussed in next chapter on physical
properties and in  As
can be seen from this world map, the salinity of the oceans varies between
30 and 37 (3.0 and 3.7%). In regions with high evaporation, the seawater
becomes saltier, whereas salinity drops in the cooler regions, due to melting
ice masses. Normal seawater has about 35 gram of dissolved salt per litre
(leaving 965 gram of water), which makes it 24 g denser at 20ºC (see
table below). You can make saltwater by adding 35 gram of sea salt to a
litre of water. Swimmers notice that it is easier to swim in the sea than
in fresh water, because they float better. An 80 kg person displaces about
80 litre of water. Each displaced litre is 24 gram heavier and provides
as much extra flotation. In total: 80 x 24 gram = 1920 g = 2 kg! The sea
water provides 2 kg more flotation. Divers know this, and they adjust their
weight belts accordingly.
As
can be seen from this world map, the salinity of the oceans varies between
30 and 37 (3.0 and 3.7%). In regions with high evaporation, the seawater
becomes saltier, whereas salinity drops in the cooler regions, due to melting
ice masses. Normal seawater has about 35 gram of dissolved salt per litre
(leaving 965 gram of water), which makes it 24 g denser at 20ºC (see
table below). You can make saltwater by adding 35 gram of sea salt to a
litre of water. Swimmers notice that it is easier to swim in the sea than
in fresh water, because they float better. An 80 kg person displaces about
80 litre of water. Each displaced litre is 24 gram heavier and provides
as much extra flotation. In total: 80 x 24 gram = 1920 g = 2 kg! The sea
water provides 2 kg more flotation. Divers know this, and they adjust their
weight belts accordingly.
 Productivity
on land depends on how well plants are growing. Plants need moisture, nutrients,
carbon dioxide, sunlight and warmth. Depending on the reliable availability
of these, plants will be more or less productive. Of the five requirements
mentioned, moisture comes number one, with sunlight and thus warmth next.
Although carbon dioxide is equally available all over the world, plants
compete for this resource so fiercely that it limits the growth of most
plants. Some plants do better than others in scavenging carbondioxide from
the air. Since the nutrients in soils are reasonably well spread over the
continents, these are not of prime consideration.
Productivity
on land depends on how well plants are growing. Plants need moisture, nutrients,
carbon dioxide, sunlight and warmth. Depending on the reliable availability
of these, plants will be more or less productive. Of the five requirements
mentioned, moisture comes number one, with sunlight and thus warmth next.
Although carbon dioxide is equally available all over the world, plants
compete for this resource so fiercely that it limits the growth of most
plants. Some plants do better than others in scavenging carbondioxide from
the air. Since the nutrients in soils are reasonably well spread over the
continents, these are not of prime consideration.
 A
number of orbiting satellites, all in orbits crossing the poles, now record
sea surface temperature and chlorophyll and a number of other parameters,
around the clock. Here is a map of actual chlorophyll levels measured in
September 1998 (northern autumn). September is the autumn month for the
northern hemisphere but the spring month for the southern hemisphere. The
sun then stands above the equator (equinox = equal night, equal
night and day). Compare this map to the one above. When all seasons are
combined, the two maps start to look alike.
A
number of orbiting satellites, all in orbits crossing the poles, now record
sea surface temperature and chlorophyll and a number of other parameters,
around the clock. Here is a map of actual chlorophyll levels measured in
September 1998 (northern autumn). September is the autumn month for the
northern hemisphere but the spring month for the southern hemisphere. The
sun then stands above the equator (equinox = equal night, equal
night and day). Compare this map to the one above. When all seasons are
combined, the two maps start to look alike.
 In
the early part of this century, Russian scientists discovered that plant
life depends mainly on evapotranspiration, the rate of water transport
from roots to leaves and out to the atmosphere. Evapotranspiration depends
mainly on temperature and the availability of water, the two qualities
along the horizontal and vertical axes of this diagram which plots the
world's vegetation. Each of the vegetation classes also has its own soil
type, rate of metabolism and standing stock (biomass). Note that the amount
of sunshine depends on how cloudy the sky is, which limits growth in places
with excessive rainfall. Notice also that high stands of vegetation limit
the amount of sunlight falling on lower tiers.
In
the early part of this century, Russian scientists discovered that plant
life depends mainly on evapotranspiration, the rate of water transport
from roots to leaves and out to the atmosphere. Evapotranspiration depends
mainly on temperature and the availability of water, the two qualities
along the horizontal and vertical axes of this diagram which plots the
world's vegetation. Each of the vegetation classes also has its own soil
type, rate of metabolism and standing stock (biomass). Note that the amount
of sunshine depends on how cloudy the sky is, which limits growth in places
with excessive rainfall. Notice also that high stands of vegetation limit
the amount of sunlight falling on lower tiers.  In
this map, the original vegetation of the world is shown, before humans
started to farm it extensively. Note how productivity on the land is largely
dependent on climate and how very large areas of the continents are covered
in either desert or tundra and ice. Compare this map with the previous
ones and notice the kinds of vegetation that are the most productive. Note
that vegetation maps from various authors do not show exactly identical
boundaries, perhaps because these are difficult to define. For more information
about terrestrial ecosystems, their soils and productivity, visit
In
this map, the original vegetation of the world is shown, before humans
started to farm it extensively. Note how productivity on the land is largely
dependent on climate and how very large areas of the continents are covered
in either desert or tundra and ice. Compare this map with the previous
ones and notice the kinds of vegetation that are the most productive. Note
that vegetation maps from various authors do not show exactly identical
boundaries, perhaps because these are difficult to define. For more information
about terrestrial ecosystems, their soils and productivity, visit