Water, ice and vapour the capricious role of water By Dr J Floor Anthoni (2010)
www.seafriends.org.nz/issues/global/climate2.htm
(This chapter is best viewed in a page-sized window and best navigated
by opening links in a new tab of your browser)
Water is the most amazing and counter-intuitive
substance on Earth and without it, life would not be possible. It is also
present in unimaginable quantities, exerting an influence on almost anything
that moves. It occurs as water, ice, vapour and cloud, and is a main actor
in climate. One cannot understand climate and global warming without understanding
water.
Ice shelves form around both the north and south poles. Understanding
how they grow and shrink is important before conclusions can be drawn from
their varying extents.
Glaciers are rivers of ice found on mountains and near the ice caps.
They exhibit life-like behaviour, and their extents vary with time, moisture
and temperature.
introduction Water
is the strangest substance on Earth, by far. It should be a gas at Earth's
temperatures, yet it occurs as a liquid, a solid, a gas and as cloud. Take
for instance a related substance, hydrogen sulfide (H-S-H), which is as
close as one can get to water (H-O-H). H2S has molecular weight 1+32+1=34,
whereas water H2O has 1+16+1=18, and is thus substantially lighter than
hydrogensulfide. Yet water occurs as a liquid and H2S only as a gas.
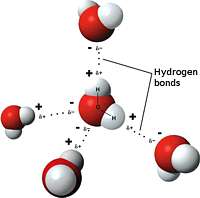
It is evident that water molecules like to cluster together to form
bigger clumps, and this property is attributed to its unique shape and
electrical polarity, shown in the drawing. Its peripheral H+ atoms attract
the central O- from another molecule, and vice versa so that four molecules
form a pyramid. This pyramid is not entirely symmetrical, such that it
attracts to other pyramids and so on.
Other properties of water are no less spectacular:
tasteless, odourless: water is so 'neutral' that it has neither
taste, nor odour.
transparent: water is very transparent, more transparent than glass
or other known substances. But its own colour is slightly blue. Light interacts
with water molecules in what is known as Rayleigh scattering, which gives
it its blue colour by day (not by night).
three phases: water occurs on Earth in three phases, as liquid,
ice and vapour. In addition it forms stable aerosols called clouds in many
forms. It also forms snow crystals of many forms and ice aerosols.
affinity: water has an uncanny affinity to most substances, but
is also phobic to others.
capillary action: due to its affinity, water rises inside capillary
pipes - the thinner the capillary, the higher it rises.
neutral pH: water is chemically neutral, being equally an acid as
a base at pH=7, or neither acid nor base.
universal solvent: due to its universal affinity, it is also a universal
solvent for biochemical substances (except fats and oils), and minerals.
Thus it is the medium of transport in living organisms.
high heat content: water has a very high heat content, able to store
energy from heat.
high latent (hidden) heat: even though water occurs in all three
phases, it requires/releases much heat when changing from one phase to
another. In this manner it has a high heat transfer capacity in the atmosphere
and an 'inertia' in changing from one phase to another.
available in large quantities: water is the most common substance,
covering 71% of Earth's surface with a staggering volume of 1,360,000,000
km3 (1.36E9 km3)
water changes its properties with size: a water droplet, cupful,
swimming pool, lake and ocean have different properties. A droplet is dominated
by surface tension; the sea has waves, currents, tides and stratification
(thermoclines).
In this chapter about water, ice and vapour, the various properties of
water in relation to climate will be discussed. From these, we can understand
the properties of ice shelves and glaciers, and to some extent how ice
ages work.
Important points:
the points mentioned above
water is weird - stranger than we can imagine
water is the main actor in climate and life
all life is based on water
it is the main transporter of what plants and
animals need
Where
is Earth's water found? The table on right shows
where all the water is found, its estimated volume and how high it would
reach if evenly spread over the globe. Also estimated residence times are
shown.
Most of the water is found
in the oceans of course, followed by ice caps and ground water. The atmosphere
contains a negligible amount of water, yet this water plays a most important
role in regulating Earth's climate. The total amount of water is 1370 +
4 + 30 = 1400 million cubic kilometres (bold figures).
Cycle times or residence
times are rather deceptive because although it would take millennia to
recycle all the water in the oceans, its surface layers recycle fast -
where else is atmospheric moisture coming from? Deceptive also is soil
moisture, some of which (permafrost) is not recycled. However, being 5
times larger than that in air, it plays an enormously moderating role on
climate (summer begins only when soils have dried up).
Earth's water balance
(Murphy et al. 1987)
(*) equivalent depth as
if evenly spread over Earth's surface
reservoir
volume km3
depth * m
residence time
atmosphere
oceans & seas lakes & reservoirs
river channels
swamps
in plants & animals
in soil
ground water frozen water
13000
1370E6 125000
1700
3600
700
65000
4E6 30E6
0.025
2500
0.25
0.003
0.007
0.001
0.013
8
60
8-10 days 4000 years
hundreds of years
2 weeks
several years
1 week 2 weeks to 1 year days
tens of millennia
The groundwater role is not
clear, because excess moisture in soil flows into rivers within days, but
deep aquifers are permanent if not tapped by agriculture.
Total evaporation
is estimated at 250km3 per day!
Note that the words warmth and heat are often used interchangeably,
but there is a difference. Warmth is the energy content of
a substance, whereas heat is the energy in transfer from
a warm object to a cold object. Cold is identical but opposite in
the way it is used. Hence our introduction of the word coolth which
is equivalent to lack of energy stored, similar but opposite to warmth.
physical properties The most important physical properties of water, relevant to climate
are how it changes phase with temperature and pressure, its latent and
specific heat, and the importance of humidity. Latent and specific heat
will be dealt with again in the next chapter.
Water, ice and vapour Water
is the most important substance on Earth, but is rather difficult to understand.
Let's begin with a diagram showing how it changes to ice and vapour, depending
on temperature (horizontal) and pressure (vertical). For ease of understanding,
the conventional graph is mirrored upside down such that higher pressures
are found lower in the graph (as on Earth). We use the unit of pressure
of bar (for barometric pressure or atmosphere), which is
1 on Earth's surface. There are three red lines that separate water from
ice and vapour, coming together in the triplepoint where water exists
in balance with ice and water vapour. Note that these three lines represent
the boundary conditions where an equilibrium (balance) exists, such as
can be done in an experiment. The thick black horizontal bar represents
the surface of Earth, where barometric pressure is one atmosphere. It extends
from -50ºC to +50ºC, roughly the maximum range of surface temperatures.
The diagram also shows four coloured shapes, which make the picture more
interesting.
The blue shape for water runs between 0 and +50ºC, narrowing
towards higher pressures because it becomes colder in the deep sea. The
pressure under water changes by 1 bar for every 10 metres, so that 1000
bar (1E3) is found in deep ocean trenches. Should a volcanic vent produce
hot water of +200ºC (far right bottom), it can exist as steam because
its location in the phase diagram is above the red curve separating water
and vapour.
Although the whole ocean covers over 70% of the planet's surface, mostly
at temperatures above 0ºC, the phase diagram shows that this is in
the vapour phase, indicated by the lighter triangle named evap for
evapotranspiration.
What it means is that surface water is not in balance anywhere on Earth,
and that it will always be 'eager' to evaporate, the rate of which depends
on temperature (and wind + waves). Water can exist in rivers and lakes
above sea level, but this means that it will be even more out of balance.
Fortunately, temperature decreases with altitude by 0.6ºC per 100m.
Life owes its existence to evapotranspiration because it enables plants
to draw water from the soil, all the way to their leaves. In addition,
all oceans are continually evaporating moisture which then rains down on
the land, thus supplying terrestrial life with a steady supply of water.
More about this below.
On its left in the graph, water is bounded by ice which
can exist in thickness of several kilometres, and thus high pressures.
The line down from the triplepoint, tilts slightly such that high pressures
do melt ice. A female ice skater places 50kg on a square centimetre skate,
which amounts to 50 bar, enough to melt ice of -2ºC.
Ice can be found in high mountains, where it can sublimate (evaporate
direct from ice to vapour) to the air, but in order to melt, its temperature
must increase to above 0ºC. Ice is about 9% less dense than water,
so the vertical pressure scale is 10 bar for 11m of ice. Note that in salt
water the red melt line runs somewhat to the left because salt lowers the
freezing point.
From the diagram it can be seen that ice, unlike water, is not out
of balance at the surface pressure of 1 bar. It is thus a very stable form
of water. However, with altitude, ice sublimates as shown by the missing
triangle, and cold air can still hold a sizable amount of moisture (see
diagram below). However, a substantial amount of latent energy is required
to do so (623 cal/g) compared to melting (80 cal/g).
Water vapour
pressure and temperature Water
vapour, better known as steam, is a gas that serves civilisation
in its use for steam engines and steam turbines (and much more). The graph
shows how steam pressure increases rapidly with temperature, to such extent
that above 120 degrees, it can do work, like converting heat
to electricity in power plants. But at earthly temperatures, it cannot
do so. Even so, water remains the most important substance for transferring
heat and for equalising the temperature of the planet (blue shape). In
the next graph we'll examine how it works.
Water vapour is found only in air, which rapidly thins with altitude,
shown as the purple shape below and the light blue shape above, following
the dashed temperature line in the phase diagram. Notice that at some stage
the temperature of the air crosses into the ice phase, above which clouds
may turn into ice (snow). The troposphere ends at 0.2 bar (11km) where
the tropopause is, then warms to just below freezing point in the stratosphere
which ends at 0.01 bar in the stratopause (47km).
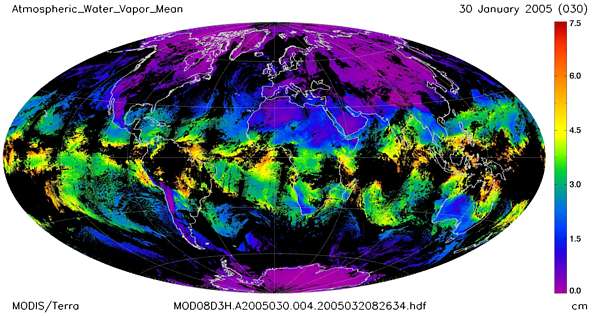
Water content of air The
amount of water found as water vapour is very small, no more than an ocean
of 3 cm deep (0-7cm). It is found only in air. The graph shows the amount
of water in air, against temperature, in red as a percentage and in green
as grams per cubic metre. Cold air holds substantially less water than
warm air, and not shown, this amount decreases rapidly with altitude. Shown
are also the ranges for three habitats: the ice caps extending below 0ºC;
the oceans from 0 to 27 ºC (overlapping the world's green plant belt);
and the deserts which could produce much water vapour if only they had
water.
Also shown is water vapour's partial pressure 0-40mbar which corresponds
to 0-4% (purple curve, 4% of 1 bar = 40 mbar). This curve represents the
water's 'eagerness' to evaporate.
Below 10ºC it roughly follows the red curve, which implies that the
water 'space' in air (saturation fraction) equals its 'eagerness' (vapour
pressure) to occupy that space, resulting in 50-60% relative humidity.
But above 10ºC water's 'eagerness' to evaporate gradually exceeds
the air's capacity for it. As a result, towards the tropics, the air rapidly
becomes fully saturated to 90-100% relative humidity. And as can be seen,
the situation with deserts becomes rather extreme, hence their paucity
(few) of life. But the consequences of this go much further.
Surrounding the purple curve is drawn a light purple shape, meaning
that the temperature of the ocean (purple) usually differs from that of
the air. The right-hand side of this purple shape corresponds to a cold
ocean under warm air, and obviously, the water is unable to fill the air's
capacity for water, resulting in low relative humidity, dry air. The left-hand
side of the shape corresponds to cold air over warm water, which
causes high relative humidity, damp air.
Important points:
ocean currents have a major effect on coastal
climates because they transfer warmth to cold places and coolth to warm
places. The El Niño/ La Niña
variation in ocean currents has a significant influence on global climate.
where cool water meets warm air, such as in all
places of ocean upwellings, the air is dry, resulting in drought (Galapagos,
Chile, California, Namib Africa's west coast, etc.)
where warm water meets cool air, the air is moist,
resulting in rain and snow (NE USA, Ireland/England, etc.)
cold seas cause dry, hot summers with cold nights.
Warm seas cause the opposite.
the summer can begin only when all surface moisture
of the winter has evaporated.
if the atmosphere heats more than the oceans,
precipitation decreases. If oceans heat more than the atmosphere, precipitation
increases.
the principles discussed here may be the main
driver of ice ages, see
further below.
The mean annual precipitation for the planet is about 1 metre, which indicates
a rapid turnover of water in the air - on average, the residence time of
a water vapour molecule in the atmosphere is about 9 to 10 days.
Our extensive section about soils
and their ecology, analyses the importance and consequences of evapotranspiration.
The world map below shows where moisture is found in the air, as expected,
mainly around the equator.
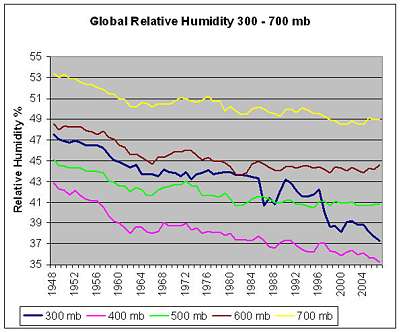
Global relative humidity Humidity
of the air has been measured by weather balloons, which give accurate results.
Their data shows that relative humidity has been decreasing in the upper
troposphere, particularly at 0.3 bar at the uppermost boundary. But even
at 0.7 bar (?km) it has decreased by 4% over
50 years. Why this happened or what it means, is not known, but since water
vapour is thought to be the most potent
greenhouse gas, a decrease
may have contributed to cooling of the atmosphere.
Decreasing humidity in air could be explained as follows (not proved):
as we produce more greenhouse gases, water vapour decreases, so that the
total out-radiation remains constant. This saturated greenhouse
theory comes from Miscolzcy.
the sun has reached its solar maximum when cosmic rays are minimal. Now
the sun's protective shield is diminishing, and cosmic rays increasing,
turning vapour into cloud. At the moment (2010) the sun is going through
a minimum. See the chilling stars.
as we produce more aerosols and dimethylsulfide, more vapour is turned
into cloud and rain.
Important points:
only at 0ºC is water in equilibrium with
ice and vapour. At lower and higher temperatures it is either sublimating
or evaporating.
the rate of evaporation depends on the difference
between vapour pressure and relative humidity, which increases rapidly
with temperature above 10ºC.
the amount of water in the atmosphere is very
small but it transfers most of the heat by condensation to cloud and rain/snow.
evapotranspiration is the most important factor
in plant life, and thus the habitat zones of the world.
examples from daily life:
the washing dries much better when warmed slightly
(in the sun), while air passes over it.
before putting on your dive mask, make your face
cool in the water. This reduces evaporation from the skin and helps prevent
the glass from fogging. (spitting and rubbing is also needed)
more rain falls by night than by day. Because
the night cools the air.
When water vapour (a gas) condenses to
cloud/rain (a liquid), it creates a sudden vacuum of up to 40mbar
which drives winds and tropical cyclones (hurricanes). Meteorology
assumes that winds move from high to low pressure areas but this may well
be wrong as winds create lows and highs while chasing rains (condensation).
Physical
constants of water and ice (1
cal = 4.184 J, source: www.engineeringtoolbox.com)
Maximum
density at 4 ºC
Specific
Weight at 4 ºC
Specific
weight/density of ice
Freezing
temperature
Boiling
temperature
Latent
heat of melting
Latent
heat of evaporation
Critical
temperature
Critical
pressure
Specific
heat capacity water
Specific
heat capacity ice
Specific
heat capacity water vapour
Thermal
expansion from 4 ºC to 100 ºC
Bulk
modulus elasticity
Very large volume times
high specific heat capacity
Atmosphere only equates
to 10m depth
Speed times mass
Ocean currents are slow
and superficial. Winds are fast.
the water-holding capacity of
the atmosphere increases by about 8% per degree Celsius
the mass of water in the atmosphere
is 13E15 kg
the mass of carbon dioxide in
the atmosphere is 2.5E15 kg
there are more than 12 times
as many water molecules in air than carbondioxide molecules.
Reader please note that this aspect of climate has been
overlooked or under-reported.
Latent heat, specific heat
and heat capacity The
name latent heat (concealed heat) is used for the heat required
to change from one phase to the other (e.g. melting, evaporating) without
changing temperature, whereas heat capacity (=specific heat)
is the amount of heat required to warm a standard unit by one degree, without
changing phase. In the diagram we are using the conventional units for
warmth (energy), the gram-calorie or cal (not to be confused with
the food-calory which is a kilo-cal =1000cal). To warm a block of ice of
1000g from -10ºC to 0 ºC takes 5000 cal because heating ice requires
0.5 cal/g/ºC as shown in the diagram under <->. The latent heat
of 80 cal/g must be provided (=80,000 cal) to melt the block, still at
0 degrees. To heat it further as water, to 100 degrees, requires 1000 x
1 x 100 = 100,000 cal because water's heat capacity is 1 cal/g/ºC.
To evaporate this water requires a whopping latent heat of 540 cal/g,
amounting to 540,000 cal. From there on, as pure steam without air, requires
0.5 x 1000 cal per degree.
steps in heating 1kg ice from -10º heat ice from -10 to 0 degrees
melting only
heat water from 0 to 100 degrees
evaporating only
heat steam from 100 to 150 degrees
Total
Note that this example bears
relevance to deep-frying items from the deep-freeze (-18ºC), and how
to do it with the least loss of heat and moisture. The freezer temperature
plays only a little role, and the energy to melt, then to heat to 100 degrees
in fat of 190 degrees is of main concern. Worst is the heat lost unnecessarily
in evaporating moisture, which could amount to 250,000 cal for 50% loss
in moisture. In small fryers it is often necessary to bring the fat up
to heat by removing the food after 1 minute of melting, after which the
oil is then hot enough to crisp the food without appreciable loss in moisture.
In this manner both half the heat and half the moisture can be saved, resulting
in crisp yet moist food and also in higher through-put (and health).
When water vapour exists in air at 2%, it adds 0.02 x 0.5 = 1% to the
air's heat capacity, which is negligible. However, by changing phase from
vapour to cloud, it releases a latent heat of 0.02 x 540 = 10.8 (cal),
equivalent to 10.8 / 0.5 = 22 degrees of warming. Water vapour is thus
a considerable player in the transfer of heat through the atmosphere.
Juan G. Roederer: "In a highly
nonlinear system with large reservoirs of latent energy such as the atmosphere-ocean-biosphere,
global redistributions of energy can be triggered by very small inputs,
a process that depends far more on their spatial and temporal pattern than
on their magnitude"
Clouds Clouds form by water vapour changing into water or ice, encouraged
by cloud condensation nuclei which are 10-20% more common over the seas,
than over land. Droplets over sea are also twice as large as those over
land. Typically, one cubic cm (teaspoon) contains 100 droplets. Cloud droplets
grow by more vapour condensing onto them (up to 30µm), but mainly
by collisions and coalescense (sticking together) when moving around. As
they grow, they also grow faster. As water vapour condenses, heat is released,
which causes uplift of the cloud. Once droplet speed exceeds uplift, it
begins to rain. The table below shows physical properties of cloud
droplets.
Note
that cloud condensation nuclei CCN are typically smaller than infrared
wavelength but larger than light wave lengths, sometimes a single molecule
can do it. Thus raindrops begin at this size, rapidly growing to a typical
size of 10 micron. As droplets grow, also their terminal velocity (hitting
Earth) (speed) increases progressively. Note that raindrop volume (weight)
is proportional to radius to the third power, thus increasing very progressively.
During heavy rainfall, rain drops are heaviest and they are also fastest,
resulting in unexpected soil damage. A 5mm rain drop is 5x5x5 = 125 times
heavier than a typical 1mm rain drop, and its speed is twice faster, resulting
in 600 times more kinetic energy, reason why most soil erosion happens
during heavy rain storms. See soil/erosion/rain
The way snow forms is more complicated as discovered by Bergeron-Findeison.
Water does not eadily convert to ice, such that droplets occur in an under-cooled
state colder than ice. Snow crystals can then form instantaneously from
the undercooled water droplets. The formation of ice releases heat which
moderates the process. Ice crystals also grow from more water droplets
and water vapour, but also from collision and coalescence. Once their speed
exceeds the cloud's updraft, they fall out as snow, or rain in case lower
altitudes are warm.
droplet type
found in
radius µm
weight µg
speed cm/s
number per litre
cloud condensation nuclei
CCN
typical cloud drop
large cloud drop
smallest rain drop
typical rain drop
heavy storm rain drop
hail
air aerosols
most clouds
tall clouds
drizzle from thin stratiform
clouds
rain clouds
very heavy rain from cumulus
clouds
-
0.1-1
10
50
100
1000
5000
5-100mm
-
0.004
0.5
4.2
4200
525000
-
0.0001
1
27
70
650
1300
-
1 million
1 million
1 thousand
-
1
?
?
After
Wallace & Hobbs 1977
Interestingly, clouds, water vapour and rain are transparent to Earth's
microwave radiation in the 5.0 mm band. Using this property, satellites
can measure land and sea surface temperatures, even though this signal
is very weak.
Ice ages From many observations, it is known that the world has experienced
rapid climate fluctuations, known as ice ages. The temperature record
(black) below shows how an ice age begins suddenly, only to proceed gradually
with many oscillations, and that the recovery towards warm interglacials,
happens more rapidly. The gases that are associated with life (CO2 and
methane) follow in step. Notice the enormous variation of 8ºC as measured
for Antarctica. A new ice age can begin with a sudden drop in temperature
of 2-3ºC in less than a century, with disastrous consequences for
life (and humans) on Earth.
This
graph, obtained from the Vostok (Antarctica) ice core, shows the capricious,
yet cyclical nature of the past 4 ice ages as temperature (red)
suddenly dips, then declines in large oscillations to a glacial minimum
of some -8 degrees (at Vostok Antarctica). With it also the gases of life,
carbon
dioxide and methane, follow in
step. On a more detailed time scale, the gases follow the temperature rather
than the other way, which is an important observation refuting man-made
global warming.
We'll explore the glaciation mechanism by assuming that it depends on
the run-away (positive feedback) effects of:
cooling => more snow => more light reflected => more cooling
and the end of an ice age:
warming => less snow => more light absorbed => warming
There are a number of important factors:
the large amount of land around the north pole which suddenly changes albedo
(dark to light).
the north polar climate depending more on radiation than the south pole.
the polar area increasing with the square of latitude covered(surface of
a circle is proportional to radius squared), extending away from the pole.
Thus albedo increases rapidly.
temperature being very dependent on latitude, see graph below.
the very short summer season for melting the ice.
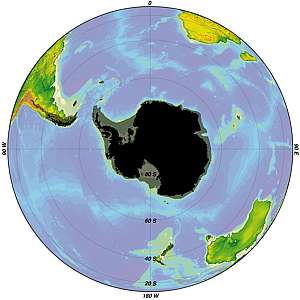
These two maps show the cardinal differences between north
and south polar regions: antarctica is a continent surrounded by ocean,
whereas the arctic is an ocean surrounded by continents. Whereas temperature
varies little over oceans, it varies enormously over land. The inner black
circle covers roughly the maximum ice extent during an ice age (see further
down).
In
this graph the average temperatures for both hemispheres are shown and
their summer and winter variations. The top shows how little the oceans
change from north to south (25 degrees) and from summer to winter (6 degrees)
and even less so near the poles and the equator. By contrast, the land
temperatures change vastly more, from north to south (50 degrees) and from
winter to summer. Notice how the polar north varies the most, due to the
large amount of land, compared to that of the oceans. In other words, radiation
(in and out) is an important part of arctic climate, reason why an ice
age has such large effect.
Notice that towards the poles, the difference between air and sea temperature
becomes an important driver of precipitation and climate.
This
graph shows the incoming radiation by month for three latitudes. Note that
during the summer months, the mid-latitudes and polar regions receive more
sunshine than the tropics because of their long days and short nights.
Notice the very short summer months for the poles. Note also in the right-hand
graph how radiation changes most rapidly in the polar regions. Thus the
effect of the summer months is rapidly negated by shorter summers and less
warming, which is what happens in ice ages.
These two maps (from Wikipedia) show the minimum (black)
and maximum extents (shaded) of ice during the past four ice ages. Note
how Antarctica (right) is hardly affected, whereas the arctic is profoundly
so. Note also how Alaska and Siberia remained exempted. This suggest that
evaporation does not occur from the Arctic Sea but from the North-Atlantic,
fed by the warm Gulf Stream. Note also how the mountain ranges block the
transport of water vapour. Also note that north America drains its water
to the east and north Europe to the west, both continents drain into the
north Atlantic. This keeps the north Atlantic cool once melting begins.
Because the air can contain only a few centimetres of water, the bulk
of the water is stored in oceans and ice caps. Thus mass transfers of water
can occur only between these two. Ironically, ice is mainly stored on land
whereas water mainly in the oceans. So an ice age can happen only by the
transport of moisture through the air, from the oceans to the ice caps.
It is a slow process, even though it appears to happen suddenly. The scenario
behind ice ages could be as follows:
first the oceans should have warmed sufficiently during a warm interglacial,
before a new ice age can begin. When and where an ice age begins, the air
is cool and the oceans warm, resulting in lots of moist air and rain/snow.
it takes only a few years of sudden cold, to cover the northern continents
in a wide swath of light-reflecting snow which does not melt in summer.
(a deep sunspot solar minimum could do it)
local runaway cooling sets in because more heat is reflected away into
space
heat moves quickly upward but slowly downward; the lower atmosphere cools
the north has an enormous area of land that can be covered in snow and
ice, in an ever widening circle that increases rapidly in its surface area
(pi * radius * radius) and thus reflecting heat back to space ever more
rapidly as it expands. Note that the snow's thickness is unimportant,
but its extent is.
the warm oceans initially have an unlimited supply of moisture to precipitate
as snow
the water cycle speeds up as more moisture condenses over the ice caps,
returning cooler and drier air to the warmer regions.
although local air temperature cools quickly and also the surface of the
oceans somewhat (making it seem to happen suddenly), it takes thousands
of years to reach a new equilibrium
contributing factors are:
CO2 flows back from land to sea, creating larger deserts and grasslands,
which reflect more light to space. (see Chapter1/daisyworld
and the carpon pipe hypothesis)
as sea levels go down, more of the continental shelves emerge, becoming
reflecting land where once radiation-absorbing sea was. About 8% of oceans
is continental shelf, but the Arctic ocean has very large continental shelves.
as ice builds up on continents, these tip downward towards mid-latitudes
(London e.g.) and upward in the Arctic. As a result, the arctic continental
shelves become shallower and eventually freeze over entirely, thereby ending
the ice age.
when an ice age ends, the oceans have cooled sufficiently to significantly
reduce the moisture in the air and hence the transfer of water to snow/ice.
A warm inter-glacial begins. Because the melt water flows direct to the
sea, the sea surface cools rapidly, inhibiting evaporation in arctic regions.
Thus warming is fast and an ice age ends fast.
the south pole is not affected much by an ice age because it is surrounded
by oceans and is already fully covered by ice, but the ice there could
grow thicker
because the process described here depends on physical quantities that
do not change (properties of evaporation and condensation, sea surface,
sea volume, heat content, land surface), one ice age resembles much the
next one and even their timing is similar. No extraordinary explanations
are necessary.
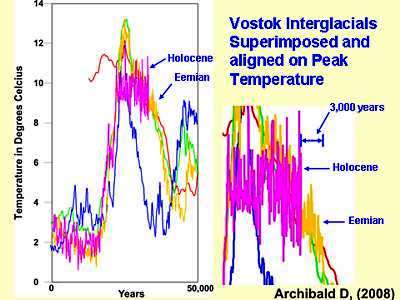
From
the Vostok (Antarctica) ice core, which goes back for 4 ice ages, it can
be seen that the temperature goes through very similar swings. In this
graph, the five interglacials have been superimposed, aligned by their
maximum temperatures. The magenta-coloured squiggle is our present interglacial
warm period, which has been remarkably level over time. It has lasted now
for over 6 millennia and the next ice age can begin any time soon (give
and take a millennium). The Eemian is the previous warm period, some 110,000
years ago.
Arctic Jacuzzi There
exists a possibility that an ice age can begin only once the arctic ocean
opens up and its ice sheets have melted away. It then becomes a source
of moisture by evaporation, where before, little moisture existed. As the
water evaporates, it is replaced by warm water from the warm Gulf Stream,
thereby accelerating evaporation. As soon as the air crosses the cool continents,
all its moisture precipitates as snow. The arctic then behaves as a warm
Jacuzzi (hotpool), transferring water to surrounding continents at an abnormal
rate. An ice age ends once the sea level drops below -100m, and the warm
Gulf Stream is choked off from reaching the arctic ocean. The Arctic
ocean has very large continental shelves (light blue on map), which would
gradually reduce the jacuzzi effect, eventually freezing over entirely.
Oceans have around 1000x the heat capacity of
the atmosphere. If the atmosphere transferred so much heat to the oceans
that the air temperature went from an average of 15°C to a freezing
-15°C, the oceans would heat up by a tiny, almost unnoticeable 0.03°C.
The
atmosphere cannot heat the oceans, because it does not have enough heat
capacity and heat wants to rise rather than sink.
Reader, please note that the above scenarios are forms
of speculation, based on physical principles. To our knowledge, the above
scenario has not been reported before, and it is here that you first read
it. Even if this scenario proves to be wrong, it still remains a good exercise
showing how many factors work together: solar radiation, cosmic radiation,
physical properties of water, physical properties of carbondioxide, curvature
of Earth, geography of land and sea, tipping continents and the presence
of life.
Ice shelves Ice shelves are found only where the sea water becomes cold enough
to freeze over during winter, such as at both poles. Because the arctic
(north pole) is an ocean surrounded by land, all arctic ice consists of
ice shelves (except for Greenland, Iceland and north Canada). During summer
as the sun light becomes stronger, the ice shelf warms up, particularly
where melt water pools form, because water absorbs infrared warmth whereas
snow reflects it. The higher temperature also causes the ice and melt water
to slowly ablate (evaporate). Because ice is a good insulator and
does not conduct heat easily, the melting below happens later and more
slowly (top-down). However, because the ice experiences intensive contact
with water, which transfers heat very effectively (bottom-up; heat moves
upward), the melting below the ice proceeds rapidly, depending on sea temperature
and currents. In the process, a layer of fresh water forms under the ice
shelf, protecting it from salt water attack. In this condition, the melting
process is very sensitive to wind, waves and currents, resulting in quite
unpredictable 'erosion'. Think of sea ice as a very thin sheet, sandwiched
between two worlds of air/wind/sun and water/waves/currents, both rather
unpredictable.
Reader please not that the currents that matter to ice shelves are surface
currents. These are driven by wind and occur only in the open water bordering
the shelves' edges. Such surface currents move the fresh water in summer
and salt lens in winter, thereby accelerating both melting and accretion.
Once the open water freezes over, the wind-driven surface currents disappear
entirely. For these reasons the boundaries of ice shelves fluctuate
unpredictably.Thus sea ice extent is not
a good measure to judge global warming by.
sea ice extent is not a good measure
to judge global warming by.
In
winter the ice shelf thickens from two sides: snow falls on top and seawater
freezes from below. As the seawater freezes, it leaves its salt behind,
creating a salt lens underneath the ice shelf. Because cold salt water
is very dense, it sinks to the bottom where it begins a long journey over
the bottom of the oceans, as part of the ocean thermo-haline conveyor belt.
The diagram shows how cold water sinks both around antarctica and the
North Atlantic, because both cold and salinity make it maximally dense.
Travelling across the equator inside deep ocean trenches, it resurfaces
somewhere in the north Pacific and Indian Oceans, as a warm water girdle
closing the loop.
Note that a layer of ice over the ocean changes its properties quite
considerably. For instance, the wind can no longer make waves and surface
currents, although it can move ice shoals. Also the water can no longer
evaporate to bring more snow, and sunlight is reflected back into space.
A solid ice shelf is thus a rather stable condition. As it melts and more
and more open water appears, the wind, waves and currents can suddenly
accelerate the melting while the open water warms by absorbing light and
heat. In addition, the life in the sea begins to bloom, making its own
contributions.
In the debate about global warming, much ado is made about the extent
of sea ice, but it is not a good indicator of warming/cooling because it
depends on so many factors that influence one another, particularly on
ocean currents. Note that sea ice, which floats on the water, cannot cause
the sea level to rise when it melts.
Important points:
it is wrong to pay much attention to ice boundaries
like sea ice extent because they are highly variable
melting sea ice cannot contribute to rising sea
levels
sea ice depends very much on currents and their
temperature and speed
a loss in ice cover does not mean a loss in ice
volume
sea ice expands and shrinks considerably, forming
cracks and stacks.
wind force over large areas can stack sea ice
high and this reduces their area covered.
when ice forms in winter, dense salt water sinks
to form deep water currents.
the mass of sea ice is more important than its
extent. Yet scaremongers report on extent only.
Is
polar temperature important? Much discussion and research
is about whether the poles are warming or not, but is this relevant? Both
poles are mainly covered in snow and ice, reflecting most of the solar
radiation they receive. Half the year, they receive no sunlight at all.
Their temperatures are unexpectedly much lower than elsewhere, with a steep
gradient in between and a constant plateau over both poles (see graph
above). With solar warmth negligible, their temperatures are determined
by the air passing over, and this is subject to large variations.
In the chapter about water
and ice we saw that ice has a rather low heat capacity and it is a good
insulator, which means that if one warms the surface, the heat very reluctantly
goes any deeper. So the temperature of the poles depends only on a very
thin layer of material and consequently has a very low heat capacity, unlike
that of the sea which has a very large heat capacity.
Furthermore, the air at
polar temperatures contains very little moisture, and thus very little
capacity to transfer heat by means of evaporation and condensation. It
is essentially dry air with very little heat content, unlike the air passing
over a body of water.
As a consequence, the poles
should be excluded from world average temperature calculations. Unfortunately
today they receive far too much importance.
Important
points:
the
poles are the ends of the world, and thus the boundaries of the 'normal'
part of the world. It is unscientific to measure at habitat boundaries
because these are always changing.
the
poles consist of snow and ice with very low heat capacity while they are
also good heat insulators.
the
poles are very small areas compared to the rest. They receive very little
sunlight.
snow
and ice reflect solar radiation and infrared heat, and the temperature
of the poles is mainly determined by winds.
winds
warm them while radiation to space cools them. Their temperatures are in
balance with these two and have little relevance to other world temperatures.
because
winds have high variability, polar temperatures do so too.
polar
winds are dry and have low heat capacity.
the
poles should be excluded from average world temperature calculations.
Glaciers Glaciers
are rivers of ice, found on the coldest slopes of mountains. They grow
in thickness by snow, which becomes compressed to ice and then to hard
ice. At a depth of about 50 metres, the hard ice deforms into metamorphic
ice, capable of distorting slowly. In this manner, the glacier indeed 'flows'.
For instance, at its bottom and sides, it flows around obstacles, but downward
of the obstacle, the negative pressure turns the flowing ice again into
hard ice, 'plucking' at obstacles. Glaciers flow faster near the surface
than near the bottom. Below the summer frost line, glaciers can melt in
summer, and below the winter frost altitude, they melt continuously. Because
ice has a high latent heat (coolth) content, melting happens slowly, and
because ice is a good thermo-insulator, it stays cold near the bottom and
inside.
The flow of glaciers is not constant but rather erratic. A glacier flows
fastest where the slope is steepest, at the top, but is hindered by the
ice lower down. It also flows faster when thicker. When it flows fast,
it extends, and when it flows slowly, it contracts.
A glacier's erratic behaviour can be thought of as follows:
Much ado is being made of glaciers shrinking due to global warming,
but glaciers are not really good indicators because their size mainly depends
on the amount of snowfall and thus the moisture content of the air. Earlier
in this chapter we saw that land use change has a major influence on the
water cycle, causing land-locked glaciers to shrink but leaving coastal
glaciers unaffected. Ironically, most glaciers are land-locked, seemingly
supporting the global warming argument.
When glaciers end in the sea, they may still be 'locked' onto the bedrock
because the ice can float only when 90% is submerged. Such glaciers can
spawn ice bergs by breaking off small pieces, small enough to float.
Are glaciers
melting due to global warming? The
melting of glaciers has been cause for concern, fanning the fear of global
warming. This graph pictures both humanity's use of fossil fuels and glacier
shortening which began almost a century earlier and which is steadily progressing.
Because glaciers shortening began before the industrial age, human emissions
of carbondioxide and their associated global warming, cannot have caused
their shortening. In this graph also the increase in sea level is shown,
tracking along the glacier-shortening curve.
Important points:
it is scientifically wrong to measure on habitat
boundaries because they are changing due to many factors.
glaciers grow and shrink naturally.
a loss in length does not always mean a loss in
mass.
land-locked glaciers shrink due to loss of moisture
from human change of land use (deforestation).
sea-bordered glaciers depend on the amount of
sea wind that brings moisture.
a small altitude change of the frost level affects
a large distance of terminal ice.
glaciers have high latent heat (coolth) and so
do ice shelves.
glaciers began shrinking at a steady rate over
a century ago, before the industrial age.
CO2 and 'global warming' have not caused them
to shrink.
Does global
cooling
cause heat-waves? Could it be that global cooling causes heat-waves? Surely not! Yet
it does! So let's investigate this further, but first a number of principles
that we've explained before:
The usual temperature, climate and weather for any place on Earth,
in any month of the year, is mainly dominated by the amount of sunshine
and the amount of moisture. Latitude and season determine the amount of
sunshine and thus warmth, whereas moisture has a moderating effect. Heat-waves
are unusual spells of unusually warm days.
All moisture comes from the sea. It is transported through the air onto
the land and some returns through rivers to the sea. Thus places near the
sea receive more moisture than places far inland, reason why all continents
have deserts in their centres.
Global temperature is dominated by the oceans because they have a much
larger heat capacity than the land. Thus global temperature is best measured
at sea.
When the planet cools, seas are colder than usual. Thus there is
less evaporation and less moisture for the land. But it becomes worse,
because winds tend to go from warmer to colder places. So on average, there
is less sea wind and more land wind than usual. Thus more moisture
than usual from the land, ends up in the sea. Conversely less moisture
from the sea ends up on land.. The result is that the land becomes drier,
sooner than usual, which gives rise to heat-waves. Nights, however,
remain colder than usual. Thus the weather and climate become more
desert-like.
Important points:
climate often works contrary to intuition.
measuring land temperatures is not a good way
of measuring global temperature.
a cool(ing) sea makes heat-waves, droughts and
bushfires more likely.
wherever cold seas flow past continents, they
cause desert climates (California, Chile, Galapagos, etc.)
global cooling has an immediate effect on the
land, and affects oceans much later due to their heat capacity.
global cooling makes heat-waves and droughts more
likely, as well as bush fires.
global cooling diminishes agricultural production.
Deluges of snow and rain.
Why? The world has been hard-hit
by abnormal weather in late 2010 and early 2011. Many articles have been
written and opinions voiced. Some even blame global warming, but what really
happened?
It is indeed an unusual
co-incidence of natural climate processes, which boil down to the following
scenario:
the world has been cooling slightly
due to a change in solar activity, as borne out by the late and few sunspots
for the coming Cycle 24. This alone accounts for:
in the summer of 2010: droughts
at mid-latitudes as explained above, accompanied by heat waves and bush
fires
in the summer of 2010: droughts
at the centres of continents with abnormally low temperatures in the northern
winter
in the winter of 2010: (some)
snow falling early, colder winter
in the winter of 2010: (some)
snow falling at lower latitudes, colder winter
during the same time over the
past three years, the oceans have experienced an unusually strong El Niño,
during which ocean currents stagnate, which accounts for:
a massive pool of warm water
accumulating in the tropics
the warmer water should have
triggered an over-active hurricane season but hurricanes cannot develop
strength (spin) if they cannot move to higher latitudes where the coriolis
force is stronger. When they did, they moved over colder water, which extinguished
them. Because of land winds, none could make a land-fall.
seas in higher latitudes becoming
colder than usual, resulting in
summer: the drying of continents,
heat waves, droughts, bush fires, etc.
winter: early snow over larger
areas
then
the El Niño ended, followed by La Niña when oceans begin
to circulate again. The massive pool of warm tropical water began its journey
poleward to higher latitudes, exactly when winter began in the north and
summer in the south, causing:
in the north: massive amounts
of snow to fall on the still cold land. The snow, reflecting sunlight,
further cooled the land, resulting in more sea wind with more snow over
ever larger areas. Note, this is how an ice age begins!
in the south: massive torrential
rains on continental margins, accompanied by flooding.
An extraordinary conspiracy
of natural factors indeed! Its aftermath will be felt as a thorough
disruption in agricultural productivity, most likely resulting in serious
famines world-wide, accompanied by social unrest.
Important points:
Ocean circulation plays an important role in the
heat transfer from equator to poles (30-60%).
Ocean circulation stagnates durning an El Niño
event, for one or a couple of years.
Oceans circulate during La Niña period
of 9 years, which used to be 27 years (before 1960), transporting heat
to varying degrees.
During an El Niño, oceans warm in the tropics
and cool in temperate areas, resulting in droughts, heat waves, cold winters,
bush fires.
When an El Niño ends (or La Niña
begins), a pool of warm water travels towards the poles, causing the opposite:
rains and snow, depending on summer/ winter in temperate climates.
The longer El Niño lasts (currents stopping),
the bigger and warmer the pool of tropical water, and the bigger its effect
on the weather once currents begin circulating again.
This weather disruption affects agriculture almost
everywhere, and dependent on the timing of events, can be catastrophic.
Crop
failures 2009-2010 The top 10 grain producers
in the World, in order, are: China India USA Russia France Canada Germany
Ukraine Australia and Pakistan. Of these top 10 producers the following
countries have experienced catastrophic failures in 2010: China due
to unprecedented flooding, India due to flooding, Canada due to drought,
Russia due to unprecedented drought, Ukraine due to unprecedented drought,
Australia due to drought and locust plague, and Pakistan, whose loss of
crops
due to never before seen flooding is near 100%. Russia has banned all exports
of grain. World's grain supply has fallen to 72 days of consumption, their
lowest level in 37 years. The Green Revolution, whose technologies had
delivered the last great surge in global food production in the 1970s and
1980s seemed to be fizzling out, a view supported by the disturbing slide
in crop yield advances. Yields of the major crops of wheat, maize, and
rice had once increased by as much as 5 and even 10 percent a year now
they were increasing by 1 percent or nothing at all.
To sum it all up, the challenge
facing the worlds 1.8 billion women and men who grow our food is to double
their output of food using far less water, less land, less energy, and
less fertilizer. They must accomplish this on low and uncertain returns,
with less new technology available, amid more red tape, economic disincentives,
and corrupted markets, and in the teeth of spreading drought. Achieving
this will require something not far short of a miracle.
"The first foreshocks were
discernible soon after the turn of the millennium. In the years from 2001
to 2008 [when global cooling set in] the world
steadily consumed more grain than it produced, triggering rising prices,
growing shortages, and even rationing and famine in poorer countries. The
global stockpile of grain shrank from more than a hundred days supply
of food to less than fifty days". [1].
Commented Joachim von Braun
[2], the head of the International Food Policy Research Institute: High
energy prices have made agricultural production more expensive by raising
the cost of cultivation, inputs especially fertilizers and irrigation
and transportation of inputs and outputs. In poor countries, this hinders
production response to high output prices."
"Food was becoming the new
gold. Investors fleeing Wall Streets mortgage-related strife plowed hundreds
of millions of dollars into grain futures, driving prices up even more.
By Christmas (2007), a global panic was building, reported the Washington
Post.
[1] Julian Cribb (2010):
The
Coming Famine. University of California Press, 2010.
[2] Julian Cribb in the
Washington Times: The Coming Famine August 24, 2010. link.
Important points:
The imminent food famine is global.
A crisis can explode within months rather than
decades (unlike 'global warming').
Global cooling and droughts will intensify as
the sun enters a dormant period.
There are many complicating factors (population
growth, growth in demand, higher energy prices, soil degradation, water
crisis, urbanisation, politics, economics, corrupted markets, futures speculation,
fuel from food).
 Water
is the strangest substance on Earth, by far. It should be a gas at Earth's
temperatures, yet it occurs as a liquid, a solid, a gas and as cloud. Take
for instance a related substance, hydrogen sulfide (H-S-H), which is as
close as one can get to water (H-O-H). H2S has molecular weight 1+32+1=34,
whereas water H2O has 1+16+1=18, and is thus substantially lighter than
hydrogensulfide. Yet water occurs as a liquid and H2S only as a gas.
Water
is the strangest substance on Earth, by far. It should be a gas at Earth's
temperatures, yet it occurs as a liquid, a solid, a gas and as cloud. Take
for instance a related substance, hydrogen sulfide (H-S-H), which is as
close as one can get to water (H-O-H). H2S has molecular weight 1+32+1=34,
whereas water H2O has 1+16+1=18, and is thus substantially lighter than
hydrogensulfide. Yet water occurs as a liquid and H2S only as a gas.
 Water
is the most important substance on Earth, but is rather difficult to understand.
Let's begin with a diagram showing how it changes to ice and vapour, depending
on temperature (horizontal) and pressure (vertical). For ease of understanding,
the conventional graph is mirrored upside down such that higher pressures
are found lower in the graph (as on Earth). We use the unit of pressure
of bar (for barometric pressure or atmosphere), which is
1 on Earth's surface. There are three red lines that separate water from
ice and vapour, coming together in the triplepoint where water exists
in balance with ice and water vapour. Note that these three lines represent
the boundary conditions where an equilibrium (balance) exists, such as
can be done in an experiment. The thick black horizontal bar represents
the surface of Earth, where barometric pressure is one atmosphere. It extends
from -50ºC to +50ºC, roughly the maximum range of surface temperatures.
The diagram also shows four coloured shapes, which make the picture more
interesting.
Water
is the most important substance on Earth, but is rather difficult to understand.
Let's begin with a diagram showing how it changes to ice and vapour, depending
on temperature (horizontal) and pressure (vertical). For ease of understanding,
the conventional graph is mirrored upside down such that higher pressures
are found lower in the graph (as on Earth). We use the unit of pressure
of bar (for barometric pressure or atmosphere), which is
1 on Earth's surface. There are three red lines that separate water from
ice and vapour, coming together in the triplepoint where water exists
in balance with ice and water vapour. Note that these three lines represent
the boundary conditions where an equilibrium (balance) exists, such as
can be done in an experiment. The thick black horizontal bar represents
the surface of Earth, where barometric pressure is one atmosphere. It extends
from -50ºC to +50ºC, roughly the maximum range of surface temperatures.
The diagram also shows four coloured shapes, which make the picture more
interesting. Water
vapour, better known as steam, is a gas that serves civilisation
in its use for steam engines and steam turbines (and much more). The graph
shows how steam pressure increases rapidly with temperature, to such extent
that above 120 degrees, it can do work, like converting heat
to electricity in power plants. But at earthly temperatures, it cannot
do so. Even so, water remains the most important substance for transferring
heat and for equalising the temperature of the planet (blue shape). In
the next graph we'll examine how it works.
Water
vapour, better known as steam, is a gas that serves civilisation
in its use for steam engines and steam turbines (and much more). The graph
shows how steam pressure increases rapidly with temperature, to such extent
that above 120 degrees, it can do work, like converting heat
to electricity in power plants. But at earthly temperatures, it cannot
do so. Even so, water remains the most important substance for transferring
heat and for equalising the temperature of the planet (blue shape). In
the next graph we'll examine how it works. The
amount of water found as water vapour is very small, no more than an ocean
of 3 cm deep (0-7cm). It is found only in air. The graph shows the amount
of water in air, against temperature, in red as a percentage and in green
as grams per cubic metre. Cold air holds substantially less water than
warm air, and not shown, this amount decreases rapidly with altitude. Shown
are also the ranges for three habitats: the ice caps extending below 0ºC;
the oceans from 0 to 27 ºC (overlapping the world's green plant belt);
and the deserts which could produce much water vapour if only they had
water.
The
amount of water found as water vapour is very small, no more than an ocean
of 3 cm deep (0-7cm). It is found only in air. The graph shows the amount
of water in air, against temperature, in red as a percentage and in green
as grams per cubic metre. Cold air holds substantially less water than
warm air, and not shown, this amount decreases rapidly with altitude. Shown
are also the ranges for three habitats: the ice caps extending below 0ºC;
the oceans from 0 to 27 ºC (overlapping the world's green plant belt);
and the deserts which could produce much water vapour if only they had
water.
 Humidity
of the air has been measured by weather balloons, which give accurate results.
Their data shows that relative humidity has been decreasing in the upper
troposphere, particularly at 0.3 bar at the uppermost boundary. But even
at 0.7 bar (?km) it has decreased by 4% over
50 years. Why this happened or what it means, is not known, but since water
vapour is thought to be the most potent
greenhouse gas, a decrease
may have contributed to cooling of the atmosphere.
Humidity
of the air has been measured by weather balloons, which give accurate results.
Their data shows that relative humidity has been decreasing in the upper
troposphere, particularly at 0.3 bar at the uppermost boundary. But even
at 0.7 bar (?km) it has decreased by 4% over
50 years. Why this happened or what it means, is not known, but since water
vapour is thought to be the most potent
greenhouse gas, a decrease
may have contributed to cooling of the atmosphere.  Note
that cloud condensation nuclei CCN are typically smaller than infrared
wavelength but larger than light wave lengths, sometimes a single molecule
can do it. Thus raindrops begin at this size, rapidly growing to a typical
size of 10 micron. As droplets grow, also their terminal velocity (hitting
Earth) (speed) increases progressively. Note that raindrop volume (weight)
is proportional to radius to the third power, thus increasing very progressively.
During heavy rainfall, rain drops are heaviest and they are also fastest,
resulting in unexpected soil damage. A 5mm rain drop is 5x5x5 = 125 times
heavier than a typical 1mm rain drop, and its speed is twice faster, resulting
in 600 times more kinetic energy, reason why most soil erosion happens
during heavy rain storms. See
Note
that cloud condensation nuclei CCN are typically smaller than infrared
wavelength but larger than light wave lengths, sometimes a single molecule
can do it. Thus raindrops begin at this size, rapidly growing to a typical
size of 10 micron. As droplets grow, also their terminal velocity (hitting
Earth) (speed) increases progressively. Note that raindrop volume (weight)
is proportional to radius to the third power, thus increasing very progressively.
During heavy rainfall, rain drops are heaviest and they are also fastest,
resulting in unexpected soil damage. A 5mm rain drop is 5x5x5 = 125 times
heavier than a typical 1mm rain drop, and its speed is twice faster, resulting
in 600 times more kinetic energy, reason why most soil erosion happens
during heavy rain storms. See  This
graph, obtained from the Vostok (Antarctica) ice core, shows the capricious,
yet cyclical nature of the past 4 ice ages as temperature (red)
suddenly dips, then declines in large oscillations to a glacial minimum
of some -8 degrees (at Vostok Antarctica). With it also the gases of life,
carbon
dioxide and methane, follow in
step. On a more detailed time scale, the gases follow the temperature rather
than the other way, which is an important observation refuting man-made
global warming.
This
graph, obtained from the Vostok (Antarctica) ice core, shows the capricious,
yet cyclical nature of the past 4 ice ages as temperature (red)
suddenly dips, then declines in large oscillations to a glacial minimum
of some -8 degrees (at Vostok Antarctica). With it also the gases of life,
carbon
dioxide and methane, follow in
step. On a more detailed time scale, the gases follow the temperature rather
than the other way, which is an important observation refuting man-made
global warming.
 In
this graph the average temperatures for both hemispheres are shown and
their summer and winter variations. The top shows how little the oceans
change from north to south (25 degrees) and from summer to winter (6 degrees)
and even less so near the poles and the equator. By contrast, the land
temperatures change vastly more, from north to south (50 degrees) and from
winter to summer. Notice how the polar north varies the most, due to the
large amount of land, compared to that of the oceans. In other words, radiation
(in and out) is an important part of arctic climate, reason why an ice
age has such large effect.
In
this graph the average temperatures for both hemispheres are shown and
their summer and winter variations. The top shows how little the oceans
change from north to south (25 degrees) and from summer to winter (6 degrees)
and even less so near the poles and the equator. By contrast, the land
temperatures change vastly more, from north to south (50 degrees) and from
winter to summer. Notice how the polar north varies the most, due to the
large amount of land, compared to that of the oceans. In other words, radiation
(in and out) is an important part of arctic climate, reason why an ice
age has such large effect.
 This
graph shows the incoming radiation by month for three latitudes. Note that
during the summer months, the mid-latitudes and polar regions receive more
sunshine than the tropics because of their long days and short nights.
Notice the very short summer months for the poles. Note also in the right-hand
graph how radiation changes most rapidly in the polar regions. Thus the
effect of the summer months is rapidly negated by shorter summers and less
warming, which is what happens in ice ages.
This
graph shows the incoming radiation by month for three latitudes. Note that
during the summer months, the mid-latitudes and polar regions receive more
sunshine than the tropics because of their long days and short nights.
Notice the very short summer months for the poles. Note also in the right-hand
graph how radiation changes most rapidly in the polar regions. Thus the
effect of the summer months is rapidly negated by shorter summers and less
warming, which is what happens in ice ages.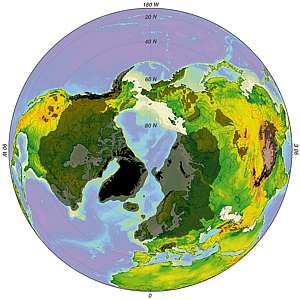
 From
the Vostok (Antarctica) ice core, which goes back for 4 ice ages, it can
be seen that the temperature goes through very similar swings. In this
graph, the five interglacials have been superimposed, aligned by their
maximum temperatures. The magenta-coloured squiggle is our present interglacial
warm period, which has been remarkably level over time. It has lasted now
for over 6 millennia and the next ice age can begin any time soon (give
and take a millennium). The Eemian is the previous warm period, some 110,000
years ago.
From
the Vostok (Antarctica) ice core, which goes back for 4 ice ages, it can
be seen that the temperature goes through very similar swings. In this
graph, the five interglacials have been superimposed, aligned by their
maximum temperatures. The magenta-coloured squiggle is our present interglacial
warm period, which has been remarkably level over time. It has lasted now
for over 6 millennia and the next ice age can begin any time soon (give
and take a millennium). The Eemian is the previous warm period, some 110,000
years ago.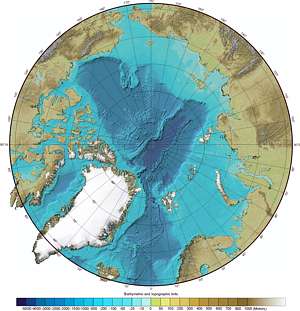 There
exists a possibility that an ice age can begin only once the arctic ocean
opens up and its ice sheets have melted away. It then becomes a source
of moisture by evaporation, where before, little moisture existed. As the
water evaporates, it is replaced by warm water from the warm Gulf Stream,
thereby accelerating evaporation. As soon as the air crosses the cool continents,
all its moisture precipitates as snow. The arctic then behaves as a warm
Jacuzzi (hotpool), transferring water to surrounding continents at an abnormal
rate. An ice age ends once the sea level drops below -100m, and the warm
Gulf Stream is choked off from reaching the arctic ocean. The Arctic
ocean has very large continental shelves (light blue on map), which would
gradually reduce the jacuzzi effect, eventually freezing over entirely.
There
exists a possibility that an ice age can begin only once the arctic ocean
opens up and its ice sheets have melted away. It then becomes a source
of moisture by evaporation, where before, little moisture existed. As the
water evaporates, it is replaced by warm water from the warm Gulf Stream,
thereby accelerating evaporation. As soon as the air crosses the cool continents,
all its moisture precipitates as snow. The arctic then behaves as a warm
Jacuzzi (hotpool), transferring water to surrounding continents at an abnormal
rate. An ice age ends once the sea level drops below -100m, and the warm
Gulf Stream is choked off from reaching the arctic ocean. The Arctic
ocean has very large continental shelves (light blue on map), which would
gradually reduce the jacuzzi effect, eventually freezing over entirely.
 In
winter the ice shelf thickens from two sides: snow falls on top and seawater
freezes from below. As the seawater freezes, it leaves its salt behind,
creating a salt lens underneath the ice shelf. Because cold salt water
is very dense, it sinks to the bottom where it begins a long journey over
the bottom of the oceans, as part of the ocean thermo-haline conveyor belt.
In
winter the ice shelf thickens from two sides: snow falls on top and seawater
freezes from below. As the seawater freezes, it leaves its salt behind,
creating a salt lens underneath the ice shelf. Because cold salt water
is very dense, it sinks to the bottom where it begins a long journey over
the bottom of the oceans, as part of the ocean thermo-haline conveyor belt.
 Glaciers
are rivers of ice, found on the coldest slopes of mountains. They grow
in thickness by snow, which becomes compressed to ice and then to hard
ice. At a depth of about 50 metres, the hard ice deforms into metamorphic
ice, capable of distorting slowly. In this manner, the glacier indeed 'flows'.
For instance, at its bottom and sides, it flows around obstacles, but downward
of the obstacle, the negative pressure turns the flowing ice again into
hard ice, 'plucking' at obstacles. Glaciers flow faster near the surface
than near the bottom. Below the summer frost line, glaciers can melt in
summer, and below the winter frost altitude, they melt continuously. Because
ice has a high latent heat (coolth) content, melting happens slowly, and
because ice is a good thermo-insulator, it stays cold near the bottom and
inside.
Glaciers
are rivers of ice, found on the coldest slopes of mountains. They grow
in thickness by snow, which becomes compressed to ice and then to hard
ice. At a depth of about 50 metres, the hard ice deforms into metamorphic
ice, capable of distorting slowly. In this manner, the glacier indeed 'flows'.
For instance, at its bottom and sides, it flows around obstacles, but downward
of the obstacle, the negative pressure turns the flowing ice again into
hard ice, 'plucking' at obstacles. Glaciers flow faster near the surface
than near the bottom. Below the summer frost line, glaciers can melt in
summer, and below the winter frost altitude, they melt continuously. Because
ice has a high latent heat (coolth) content, melting happens slowly, and
because ice is a good thermo-insulator, it stays cold near the bottom and
inside.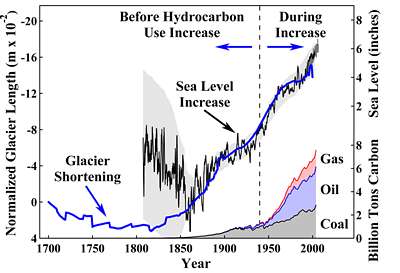 The
melting of glaciers has been cause for concern, fanning the fear of global
warming. This graph pictures both humanity's use of fossil fuels and glacier
shortening which began almost a century earlier and which is steadily progressing.
Because glaciers shortening began before the industrial age, human emissions
of carbondioxide and their associated global warming, cannot have caused
their shortening. In this graph also the increase in sea level is shown,
tracking along the glacier-shortening curve.
The
melting of glaciers has been cause for concern, fanning the fear of global
warming. This graph pictures both humanity's use of fossil fuels and glacier
shortening which began almost a century earlier and which is steadily progressing.
Because glaciers shortening began before the industrial age, human emissions
of carbondioxide and their associated global warming, cannot have caused
their shortening. In this graph also the increase in sea level is shown,
tracking along the glacier-shortening curve. then
the El Niño ended, followed by La Niña when oceans begin
to circulate again. The massive pool of warm tropical water began its journey
poleward to higher latitudes, exactly when winter began in the north and
summer in the south, causing:
then
the El Niño ended, followed by La Niña when oceans begin
to circulate again. The massive pool of warm tropical water began its journey
poleward to higher latitudes, exactly when winter began in the north and
summer in the south, causing: