Marble in space Main influences on Earth's temperature By Dr J Floor Anthoni (2010)
www.seafriends.org.nz/issues/global/climate1.htm
(This chapter is best navigated by opening links in a new tab of your
browser)
Planet Earth 'hangs' by an invisible thread
between a sun of 6000ºC and outer space of -273ºC, its temperature
depending on solar radiation, Earth's reflectivity (albedo) and outgoing
re-radiation. How do these change? The atmosphere also influences the temperature
of Earth's surface. How does it change?
Earth is the third planet from the sun. How does
it compare to its neighbours? The atmosphere to 800km altitude, the radiation
balance, temperature gradients, how is the temperature of a planet measured?
The Earth wobbles in both its rotation and orbit, and this causes small
changes in the amount of sunlight it receives, and in the intensity of
summers. The effects are very slow and small but add up.
The biggest change to our planet comes from deforestation and changing
land use. It has had a profound effect on climate, often mistaken as caused
by global warming.
Introduction When viewed from outer space, our planet Earth appears like a blue-green-brown
marble with white swirls of cloud. It is a spectacular sight which reminds
us of how special this planet is, and perhaps also how vulnerable.
Little does one realise that this blue/white blanket around the world,
and everything that lives within it, is so preciously thin. Imagine
planet Earth the size of a billiard ball (6cm diameter). Then the whole
biosphere from the deepest oceans (-10km) to the tallest mountain top (+10km)
is merely as thin as a human hair (0.1mm). Within this thin smear, everything
happens in layers: the deep ocean circulation, the shallow sea surface
circulation, the winds, clouds and rains, and all air traffic. Above the
troposphere of 10km thick, very little else happens.
Understanding this thin smear upon which our lives depend, is therefore
important. This chapter looks at Earth hanging in the balance between a
solar skin of 5800 degrees Celsius and the cold black outer space of -273
degrees. Earth's temperature depends not only on its position (which varies)
but also on the sun's light output (which also varies). And life as we
know it, depends on a small range of temperature (the Goldilock zone "just
right"). Not surprisingly, the planet has evolved with mechanisms to stabilise
its temperature, although this can't prevent the sudden swings between
ice ages and the warm periods in-between.
We are still living in an inter-glacial warm period which began some
10,000 years ago and stabilised some 7000 years ago. So the entire known
history of human civilisation happened in a single warm spell between ice
ages. It simply could not have happened in the 50,000 years of cold beforehand.
We are thus very privileged.
In this chapter we'll have a close look at our atmosphere and how it
works as a stabilising blanket. We'll study the variations in our position
relative to the sun and how the sun varies its intensity, and also at influences
caused by humans.
Planets compared Our
nearest planets are all like Earth, 'rocky' rather than 'gassy'. None produce
enough heat by themselves to make a difference (it is thought), such that
their temperatures are determined by the heat from the 6000ºC (5800ºK)
sun and how much they re-radiate back into space. The graph shows the positions
of these planets relative to the sun, measured in Astronomical Units (AU),
equivalent to the distance between sun and Earth (150 million km or 8 light-minutes).
The vertical scale is logarithmic and represents solar irradiation, the
solar constant in Watt per square metre, but also the planet's temperature
in degrees Kelvin (1K=-273ºC). For details see the table below.Note
that the degree sign º is omitted for Kelvin.
Surprisingly, the average temperature of Venus stands out due to its
dense carbon dioxide atmosphere (96% CO2) (it is thought) covered with
a white cloud of sulfur dioxide (SO2), acting like a white body.
Our solar system from left to right: Sun, Mercury, Venus,
Earth, Mars, Jupiter, Saturn, Uranus, Neptune, Pluto
distance to sun (AU)
solar constant (W/m2)
average temperature (ºC)
without atmosphere, with zero albedo (ºC)
without atmosphere (ºC)
mass of atmosphere
Mercury
0.387
9147-9449
167 (440K)
173 (446K)
167 (440K)
?
Venus
0.723
2620-2688
464* (737K)
55 (328K
unknown
4800E18 kg
Earth
1.000
1370-1402
16 (289K)
5 (278K)
-17 (256K)
5.1E18 kg
Mars
1.524
590-612
-63 (210K)
-47 (226K)
-58 (215K)
0.025E18 kg
* The Russian Venera7 measured 475ºC
before failing.
Every planet reflects some sunlight, which is the part that does not
heat the surface and atmosphere, and it absorbs the remaining sunlight.
The absorbed light interacts with the planet's surface and atmosphere,
warming it in the process (otherwise the temperature would be like that
of dark space, -273ºC). During this interaction, sunlight changes
to heat, and this is re-radiated back into space. The amount of re-radiated
energy depends on the temperature: the warmer, the more radiation. Thus
a planet absorbing all sunlight (a black body) will re-radiate all light
as warmth, by becoming warmer than a white planet. As a planet rotates,
the incoming radiation happens on one side only while the outgoing radiation
happens all around.
Thus all planets are in a state of balance such that:
But
what is the 'average' temperature of a planet with an atmosphere? Look
how the temperature varies from 15ºC at the surface to -60º at
Mt Everest (10km), back to 0º at 50km and even up to 2200º at
400 km height? Because the atmosphere thins considerably with height, the
upper levels do not have enough mass (and thus re-radiation) to play a
role. Looking from the outside in, Earth's 'average' temperature lies somewhere
between 1 and 40km, and is reported by satellites as 5º even though
Earth's average surface temperature is 15ºC. (click on diagram for
a larger version)
The diagram shows Earth's atmosphere to a height
of 800km, higher than where earth-orbiting satellites are found. The pressure
here is for all practical purposes zero (1E-50 bar). Note that the 'atmosphere'
here is made up of the two lightest gases on Earth, helium and hydrogen
which are continually gassed off to space by the solar 'wind' (a stream
of particles from the sun).
From 100 to 600 km extends the ionosphere where
sparse charged atoms (ions) move around at high speed, hence the high temperatures
of 2200º to 750ºC. In the ionosphere one finds bands that are
important to shortwave radio, as they bounce the electromagnetic signal
back to Earth, thus enabling around-the-world radio transmissions. The
higher F2, F1 and E bands are active only during the day, disappearing
by night. Thus radio programmes and their frequencies for world radio change
according to the availability of these ionised bands. At the altitude of
the E band, the atmosphere is dense enough to burn up incoming meteorites,
thus preventing most from reaching the ground. Notice that the composition
of the sparse air here is very similar to that on the ground, but rare
helium is far more common (it is a very light gas). At these heights auroras
can be seen in the polar regions, caused by fast particles colliding with
gas molecules.
At about 100km the 'temperature' has cooled to
-80ºC (the mesopause) after which it begins to rise again to 0ºC
in the stratopause. In-between is the mesosphere with the ionised D band
which is active all day and night, reflecting radio waves but not very
far.
Between 50 and 10km extends the stratosphere where
the temperature climbs from -60º to 0ºC. It can be considered
the 'lid' on the climate atmosphere, with a composition much like that
on the ground. But there is enough oxygen for ozone to be produced here,
particularly in the ozone belt between 20 and 30km. Underneath it extends
a mysterious sulfuric acid belt at about 20km (sulfuric acid is a much
heavier molecule than the normal air molecules).
Temperature is at a minimum of -50 to -60ºC
in the tropopause, another 'lid' on the troposphere where the weather reigns.
In the troposphere the air is dense enough to
trap and transfer heat, to spread it around and to even out temperature
extremes.
Whereas average ground temperature (skin temperature)
is about 15ºC, it diminishes at a predictable rate of 6.5ºC per
kilometre altitude (the lapse rate). This decrease in temperature
corresponds somewhat to the adiabatic cooling (cooling due to expansion
without loss of heat) a parcel of air experiences when rising and expanding,
and is a fixed property of gas. It seems as if the upper troposphere with
the tropopause acts like a pane of glass, a lid over the atmosphere. Underneath
it, conduction and convection of heat matter most, whereas above it in
the stratosphere, the air is too thin for that, and re-radiation (dark
radiation or infra-red) to space matters most.
Note that the atmosphere stores 1000x less energy
than the oceans. The total heat capacity of the global atmosphere corresponds
to that of only a 3.2 m layer of the 3000m deep ocean.
Leaving the effect of an atmosphere aside for a moment, the temperature
of a planet can vary because of:
variations in solar output: but the sun has proved to be a rather
stable furnace, varying its output by no more than 0.1% in the past 2000
years (it is thought). However, recent studies establish a strong link
between sunspot activity and climate (see further). For every 0.1% increase
in radiation, Earth's temperature increases by 0.001 x 288 ºK = 0.29
ºC
variations in a planet's orbit: all planets follow a path that is
not strictly circular but somewhat elliptical, as also their rotational
axes are angled, causing annual winter and summer and giving rise to very
slow Milankovic cycles. Other planets also have an influence. For
every 0.1% that Earth gets closer to the sun, temperature changes by 0.2%
or 0.6 ºC
variations in albedo (reflectivity): this is particularly the case
for Earth, a living planet. Albedo has large variations due to cloud and
ice formation. For every 1% increase in albedo, temperature cools by up
to 3ºC. The planet's average albedo is not known precisely (see section
below).
heat from inside: when radioactive elements fall apart, they produce
heat. In Earth's early history this was an important source of heat that
decayed substantially with time. However, volcanism is still active, and
some heat transfer can be expected from the mid-oceanic spreading zones
into the ocean. Little is known.
Try to remember the following rules of thumb:
If the distance Earth to
Sun becomes 1% smaller, Earth's temperature increases by 2% or 6ºC
If the diameter of the sun
increases by 1%, Earth's temperature increases by 2% or 6ºC
If the sun becomes 1% warmer,
Earth''s temperature increases by 1% or 3ºC
A 1% increase in albedo
cools the planet by 1% or 3ºC
About 99% of the atmospheric
mass lies below an altitude of 30km
Main constituents
of Earth's atmosphere (*) concentration near the
surface
In red
the greenhouse gases. In blue the noble gases.
constituent
ppm by volume
constituent
ppm by volume
Nitrogen N2
Oxygen
O2
Argon
Ar
Carbondioxide
CO2
Neon
Ne
Helium
He
Krypton
Kr
Xenon
Xe
Hydrogen
H2
Methane
CH4
780800
209500
9300
330
18.2
5.2
1.1
.089
0.5
1.5
Nitrous
oxide N2O *
Carbon
monoxide CO *
Water
vapour H2O
Ozone
O3
Ammonia NH3
Sulfur dioxide SO2 *
Nitrogen
dioxide NO2 *
other gases
aerosols, dust,
Temperature gradients The
diagram shows the temperature gradients of the atmosphere, ocean and crust.
Where a gradient (gradual change) exists, there must also be a transport
of heat along that gradient from warm to cold (right to left in the diagram).
This heat transport also depends on the density of the medium. The crust
is 3 times denser than water, which is 800 times denser than air, but it
transfers only about 0.06W/m2, which is negligible in the planet's heat
budget. The oceans (blue curve) have a steep gradient and good mixing in
the first 100m, but from 800m down, they are all equally cold to a minimum
of 4ºC, corresponding with water's highest density. The only way for
this cold water to surface, is to be replaced by equally cold water from
the thermo-haline circulation. So for practical purposes, only the
first 100-200m matter in climate change (perhaps
not
true as water as deep as 3000m shows temperature fluctuations).
The red curve shows how Earth's surface has an enormous range in temperatures,
narrowing down in the first km, such that above 3km most of the atmosphere
is equal all around the world. The gradient ends at about -55ºC in
the tropopause which marks the end of the troposphere (sphere of mixing).
All climate and weather occurs in the troposphere which is thickest around
the equator (12km) and thinnest at the poles (7km). The brown line (sorry,
here shown in red above the word "crust") shows how temperature increases
under the surface, at a rate of 25-30ºC per km. By comparison the
'lapse rate' (cooling of the atmosphere with altitude) is 6.49ºC per
km.
How is the temperature of a planet measured? When
a thermometer cannot be placed directly on a planet, scientists determine
its temperature from the heat it radiates out. For instance, this graph
shows the incoming light (yellow) and outgoing heat radiation (green) of
Earth. Because the atmosphere absorbs some 'colours', both spectra look
rather frayed. Vertical is the light intensity and horizontal the wave
length (= 'colour') in microns. Visible light runs from 0.4 to 0.7 micron,
a narrow band, whereas infrared runs from 0.8 to 50 micron, a very wide
band. The red envelope belongs to a body of 6000ºK and the green envelope
clumsily fits around the outgoing heat radiation, but with enough uncertainty
that we can't say for sure what precisely the temperature is seen from
outside the Earth: somewhere between 260 and 300K (-13 to +27ºC).
Keep this in mind when interpreting the table above.
What would the temperature be of a mirror? If the mirror reflects the
sunlight, then our space 'thermometer' would interpret the temperature
of the mirror equal to that of the sun: 6000ºK. Venus has a very dense
atmosphere consisting almost entirely of CO2. At 25km above its surface,
a temperature of 50ºC was measured, and on its surface 450-475ºC
under a pressure of 80-90 bar (80-90 times that of Earth). See Venus' atmosphere
below.
Note also that the yellow curve must be in balance with the green one,
as incoming radiation must equal outgoing radiation, or otherwise the planet
would continuously either grow warmer or cooler. The reason that the two
curves look unequal in size, is that both scales are logarithmic and not
linear. The incoming radiation envelope is narrow but high whereas that
of outgoing radiation is wide but low.
It is important to remember that the law of conservation of energy
demands that no total energy is lost, even though at any moment radiation
(=flow of energy) may be out of balance.For instance, Earth is warmed
on one side only during the day as its night side only cools.During the
day the atmosphere cools the planet whereas during the night, it warms.
One cannot average these opposing effects, as the IPCC scientists all too
happily do in their computer models and temperature series.
Another important point is that the incoming light comes from a small
spot in the sky (the solar disc), but is very bright (one billionth of
the sun's energy, 1E-9), whereas outgoing radiation radiates out to space
in all directions over almost a hemisphere (half sphere), but is rather
weak. On any part of the skin, incoming radiation is only by day whereas
outgoing radiation happens day and night.
The peak of the spectral
envelope is according to Planck's laws:
peak wavelength (µm)
= 2897 / T (ºK)
Example: peak wavelength
of incoming radiation (sun) = 2897 / 5780 = 0.50 µm
peak wavelength of outgoing
radiation (Earth) = 2897 / 300 = 9.65 µm
Earth's effective temperature
is estimated with great uncertainty, between 255 and 300K
It is not certain whether
our atmosphere is warming or cooling the surface.
Orbiting thermometer: can an
orbiting satellite measure temperature accurately? An orbiting thermometer can only measure the radiation coming from
the planet in relation to its distance from the surface. Its advantage
is that it can cover the entire surface of the planet many times each year,
even though physical thermometers are missing from large tracts of the
planet (like the oceans). Another advantage is that it does so entirely
automatically, not needing human intervention (and error), and that it
is not influenced by the Urban Heat Island (UHI) effect.
In a polar orbit its measurements must be corrected for the fact that it
'sees' more of the poles than the equator, but this is relatively simple.
However, its main difficulties remain:
pure sunlight reflection from erratic high clouds
pure sunlight reflection from erratic low clouds, filtered by an unknown
amount of atmosphere.
pure sunlight reflection from water surfaces and waves.
filtered sunlight reflection from Earth's surface, in various colours.
infrared re-radiation not from a black body but from a body with various
colours and substances (water, leaves, sand, rock, ice).
infrared re-radiation from the atmosphere.
variable amounts of filtering in the atmosphere: water vapour, various
gases among which CO2.
the daily night/day rhythm of temperature, cloud cover, re-radiation.
variable temperatures due to elevation (mountains are colder).
seasonal variation of temperature (summer in the north when it is winter
in the south).
seasonal variation of albedo, the colour of the Earth: greening/wilting,
freezing/thawing, sea iceexpanding/contracting.
land use changes: burning of forests, smoke, dust, agriculture, degradation,
river plumes.
satellite instrument degradation: temperature sensors may drift in time,
and are difficult to re-calibrate. For instance, in August 2010 one
of NASA's satellites threw a wobbly and jeopardised perhaps a decade
of satellite-derived global temperatures (too warm by several degrees C).
NOAA-16
was launched in September 2000, and is currently operational, in a sun-synchronous
orbit, 849 km above the Earth, orbiting every 102 minutes, providing automated
data feed of surface temperatures which are fed into climate computer models.
In 2011 the Total Solar Insolation (TSI) baseline was corrected downward
by a whopping 4.6W/m2 with new data from a recent satellite SORCE/TIM.
Considering that the global warming effect since 1750 is estimated at 2.6W/m2,
this implies major cooling. [Dr. Greg Kopp and Dr. Judith
Lean in Geophysical Research Letters]
Satellite temperature
guesswork The only instrument capable
of 'measuring' temperature at a distance is a radiation meter or radiometer.
Apart from being subject to the problems mentioned above, these instruments
drift (vary) over time and need to be recalibrated and brought into agreement
with measured temperatures on Earth. Thus a radiometer is good for measuring
rapid variations, but useless for measuring slow ones. Thus despite the
availability of temperature data from space for some 40 years, this data
cannot be used to show slow decadal changes in solar intensity. What's
more, their slow variations come from recalibrations against manual surface
temperatures, and are not independent of these, and are equally subject
to fraud. See the last point above, a massive 4.6W/m2 downward correction
in 2011!!!
It is not surprising then that the resulting heat signal is almost impossible
to calibrate to an 'average' temperature, and even then to correlate with
actual surface temperatures. In the process, some arbitrary corrections
need to be made, corrections that can be wrong or subjected to fraud.
For instance, if a "temperature difference" is observed, was this real
and not caused by a change in cloud formation, or a change in water vapour?
Fortunately water vapour and rain are transparent to Earth's microwave
out-radiation in the 5.0 mm band. Using this property, satellites can measure
land and sea surface temperatures, subject to some of the difficulties
mentioned above.
Note that one cannot 'average' the surface temperature because
what one really wishes to know is the surface's heat/cold content. For
instance a glacier at -3ºC contains vastly more 'coolth' than a desert
at -3ºC by night. Likewise the sea at 20ºC contains much more
available warmth than the land at the same temperature. Yet this is not
taken account of in present-day temperature measurements from which world
'averages' are calculated. As a result, 'average' temperatures are quite
deceptive and quite meaningless.
The global warming 'science' centres mainly on the radiation buget,
the ins and outs of an accountant's balance sheet, but rarely
discuss what is inside the balance sheet, the latent heat
or stored warmth and coolth in oceans and ice caps. These
by far overwhelm the annual heat balance, and no amount of mathematics
can assess their influence.
There is no adequate physics or physical
understanding of the circulation and key role of this latent form of energy
in the atmosphere, nor a real understanding of the energy conversions into
and from it. All arguments (IPCC) are reduced to radiative treatments
of electromagnetic energy, plus the mechanics of the movements of cold
and hot air masses.
Important points:
although the sun's outer skin is about 5800ºC,
its internal nuclear fusion reactor is 10-15 million degrees.
Earth exists in a radiation balance between the
hot sun and very cold space.
Earth's atmosphere is very complicated.
Earth's temperature is affected firstly by albedo
(cloud), secondly by its distance to the sun and lastly by the variations
in the sun's output.
the lower atmosphere evens out differences in
temperature (cooling by day and warming by night).
'average' skin temperatures are almost impossible
to measure and make no sense anyway.
the most important latent but convertible heat
is left out of the energy budgets.
satellite temperature data is useless for slow
variations.
Earth's albedo The proportion of light reflected from the Earth's surface back to
space is called albedo(whiteness) after the Latin word albus
for white. It is identical to the Outgoing Shortwave Radiation (OSR) in
the radiation budget, with spectral properties in the range of those of
the incoming light from the sun. However as light interacts with substances
on the surface, it changes colour (its spectrum) and intensity. Light coloured
objects like snow have high albedo (see table below) whereas dark objects
like forests and oceans have low albedo. When albedo increases, more light
is reflected back to space, resulting in cooling of the atmosphere. Albedo
thus has a large influence on global temperature. As Earth's average is
around 30%, there remains ample scope for increases and thus temperature
regulation.
Albedo
and emissivity
surface type Earth average (!)[2]
ice
snow
water (*)
desert sand
bare soil/loam
granite (mountains)
ploughed field
green grass
deciduous trees
conifer forest
asphalt, worn
black asphalt
black body
cirrus cloud
stratus cloud
cumulus cloud
cumulonimbus cloud
(!) at
equator 19-38%; at poles ~80%; varies with cloudiness
(*) water reflects like
a mirror at low light angles and is wind (wave) dependent
[1][2] see links below
The world maps show how
large the influence of clouds is. Data from CERES satellite.
In top earth picture: Note how the deserts and grasslands have high albedo.
Of all the types of cloud, the rainstorm cumulonimbus (equator) is most
reflective. Note also how water absorbs nearly all light, but at low angles,
reflects almost all light.
Planetary
albedo is the ratio of reflected radiation divided by the total incoming
radiation. Thus the emitted longwave radiation is what is left over in
order to balance incoming and outgoing radiation:
E = ( 1 - A
) x S / 4
Where A=planetary albedo;
S=
solar constant; 4= the ratio of the cross section to the surface of
a globe: The amount of sunlight falling on Earth is that intercepted by
a disc the size of the Earth. This energy is then spread over the whole
surface of the globe (not evenly though): area of disc divided by area
of globe:
pi x r
x r / 4 x pi x r x r = 1 / 4
If Earth's albedo = 0.30 and
S = 1380 W/m2, then E = 0.7 x 1380 / 4 = 241 W/m2
From the Stefan-Bolzmann
equation (below) it follows that
T=255K. Consensus centres on 4-5ºC=277-278K
Reader please note that
this leaves a lot of guessing and uncertainty.
Ground albedo
and cloudiness by latitude This
graph shows how average albedo on Earth changes with latitude (red curve).
In the background a map of the earth showing normal (light green, plains/grass)
and extra dry (yellow, deserts) or wet (dark green,forests) areas The sea
was left white but should have been dark-blue. Albedo
is low (dark) at the equator, and high (light) towards the poles. There
exists a marked difference between northern and southern hemispheres mainly
because there is more ocean down south. The desert bands (20-35º)
do not make much impact because at their latitudes, still a lot of ocean
is found. Between -60 and -70 degrees latitude, albedo increases steeply
because Antarctica is a white continent surrounded by dark oceans. The
south pole is also whiter than the north pole because the north pole is
an ocean surrounded by continents, and in summer with less sea ice.
The average cloudiness by latitude is the
blue curve, obtained from the IPCC. It somehow disagrees with the average
Earth albedo of 0.3, so consider it somewhat lower. It shows that there
is little cloud over Antarctica but much over the Arctic. The desert bands
now show up in the form of dips on both sides of the equator (not precisely?).
Now remember that all rain comes from the sea, which means that we cannot
expect the clouds over land to contribute much to temperature regulation.
Neither can we expect the deserts to contribute (no cloud, reflective already),
nor can the southern hemisphere because it is already rather cloudy. Also
both poles disqualify because they see little sunlight. Thus the Earth's
capacity to regulate its temperature must come mainly from the tropics
where most light falls and where warmth contributes to evaporation. It
appears then that Earth's temperature self-regulation is rather limited.
On any given day, about half of Earth is
covered by clouds, which reflect more sunlight than land and water
Energy
radiation from a less than black body An 'ideal' black body is
both a perfect absorber as well as radiator; absorbs ALL incident radiation;
and emits in all directions equally.
The energy radiated out
to space from a body with emissivity is proportional to the fourth power
of its absolute temperature in ºK, according to the Stefan-Boltzman
equation:
j = emissivity x
sigma x T^4 (Watt/m2)
where emissivity is
1 for a black body and 0.99?? average for
Earth
and sigma = 5.6703
10-8 (W/m2/K^4), the Stefan-Boltzman constant
sun's radiation =
(5.6703E-8) x (5800 ºK) ^4 = 6.42E7 W/m2 at its surface
Incoming radiation at
Earth = sun's radiation / ( radius of sun / orbit
of earth ) ^ 2 = 6.42E7 / (125)^2 =
= 1389 W/m2 = solar constant
[1,2]
A 1ºC change in Earth's
average temperature, could be caused by a change in: solar constant 1.4%
(incoming radiation) or albedo 3.3% (day) or effective emissivity 1.4%
(night). (1.4 = square root of 2)
[1]
Gerlich & Tscheuschner (2009)
[2]
several values of the solar constant have been quoted, depending on the
estimated temperature of the sun.
Sea temperature and albedo The
albedo of Earth has been reconstructed from overlapping satellite images
(blue line, Pallé E et al. 2004), here graphed upside down because
an increase in albedo makes the planet more reflective, thus cooler. Note
how albedo diminished (less cloud cover) a massive -10% in as little as
15 years, corresponding to a radiative 'forcing' of +10W/m2 or 0.6W/m2
per year. By comparison, the IPCC worries about a warming effect of 2.4
W/m2 in a century. In red, the sea temperature from Endersbee. Note the
strong correlation between albedo and temperature. Note also that most
of the sun's radiation ends up in the sea from where it escapes more slowly
than from the land.
CERES is the Clouds and Earths Radiant Energy System instrument, operational
since 2000. Nasa mentions that a 1% reduction in albedo would equate to
3.4 W/m2, which conflicts with the above diagram. A recent publication
estimates increased effective radiation at 0.15 W/m2 per year [3].
The purple curve is the total increase in global cloudiness (%), which
tracks very well the increase in albedo [4].
Important points:
Earth's albedo is the most important factor in
climate, yet is still unknown, even though measuring it from space with
the earliest satellites (like MODIS), would have been very simple and would
have given us an important record since 1970.
albedo (by cloud formation) is the planet's most
important 'lever' for stabilising temperature.
do not confuse albedo (0-1, light reflection)
with emissivity (0.96 to 0.999, infrared re-radiation).
decreases in albedo can explain all global warming
experienced in the past two decades.
decreases in cloud cover are the most likely cause
of decreases in albedo, supported by a strong correlation.
cloud albedo works only by day because it works
by reflecting sunlight.
cloud albedo does not work over ice (Antarctica,
North Pole, mountain regions) because albedo there is so high already.
Neither does it work over deserts, because these have few clouds and reflect
light already.
[1] Engineering Toolbox. link.
link2.
[2] Note that emissivity is often
confused with the complement of albedo: (1 - albedo). Simply put, albedo
gives the amount of reflected visible light (by day), whereas emissivity
gives the correction in infrared 'dark' radiation affected by the nature
of the substance (by night). Values quoted: 0.612, 0.75, are wrong. World
average emissivity is not accurately known, but is close to 0.99.
Emissivity also varies with wavelength for each substance, much the same
as absorption does. link.
[3] R. T. Pinker, B. Zhang, E.
G. Dutton (2005): Do Satellites Detect Trends in Surface Solar Radiation?
: "Solar radiation at Earth's surface from 1983 to 2001 increased at a
rate of 0.16 watts per square meter (0.10%) per year; this change is a
combination of a decrease until about 1990, followed by a sustained increase."
Agrees
roughly with blue curve above.
[4] http://mclean.ch/climate/Cloud_global.htm
cloud cover web site using data from the ISCCP D2 dataset (International
Satellite Cloud Climatology Project).
Milankovic cycles In
order to understand Milankovic cycles, it is important to first understand
how summer and winter arise. In the diagram, Earth is shown rotating around
the sun in a counter-clockwise direction when looking down from the north.
The planet itself rotates around its axis in the same direction, but at
a slight angle of 23.5º. Northern hemisphere summer occurs when the
northern half tilts towards the sun in June, and likewise for the southern
hemisphere in December. In the northern summer, Earth is also 1.7% closer
to the sun, thus the northern summer gets 3.4% more sunlight (= 3.5% more
heat) or 1.7x3= 5 degrees C (see above), and the difference between northern
and southern hemispheres amounts to 7 % in heat or 10 degrees C. These
differences are quite large and have an influence on the climate system.
Milutin
Milankovic (28 May 1879 12 December 1958), was a Serbian civil engineer
and geophysicist, best known for his theory of ice ages, relating variations
of the Earth's orbit and long-term climate change, now known as Milankovitch
cycles. The diagram (from Wikipedia) shows the nature of the cycles and
how these influence solar radiation (solar forcing). Milankovic thought
that the ice ages could be explained this way. However, the planet has
known ice ages only during the Pleistocene, back to 1.6 million years ago
whereas the Milankovic cycles must be very much older. Note also that there
is no hard correspondence between the oscillations shown and the recorded
ice ages.
Remember also that the effects of the Milankovic cycles is very small (max
+/-50W/m2
of 1370 W/m2 or +/- 3.5%), much smaller than changes in albedo can achieve.
Note that the Milankovic cycles all assume that the power of the sun remains
constant, but is this so?
Important points:
Earth's climate is subject to very slow cycles.
but their influence is small, except for summer/winter.
the north pole 'looks' at the opposite side of
the universe, compared to the south pole, experiencing different amounts
of cosmic radiation.
the NH to SH difference is large
Milankovic cycles may trigger ice ages but do
not cause them.
The mystery of the faint
young sun Over
thousands of millions of years (eons), the sun has become brighter, and
during the 4.5 eons that Earth had a crust, its luminosity increased by
about 25% (red curve). Plotting Earth's temperature back in time (blue
line), Earth should have been a snow ball earlier than 2 eons ago, but
ancient rocks show neither such low temperatures, nor excessive CO2 to
balance the heat. To make matters worse, at that time, life had not invaded
the land, and it looked like a large bright desert, reflecting much of
the solar radiation back to space. However, back then, the oceans were
also larger, which is where most solar radiation was absorbed. Thus the
surface temperature shown in the diagram (blue line) must be adjusted upward,
above 273ºK (0ºC, the freezing point of water), following the
early accretion of Earth's crust(brown shape) consisting of high albedo
rock and desert.
The dashed blue curve shows our graphical adjustment of surface temperature
for the sea/land ratio, dipping below the 0ºC line at 4 eons ago when
Earth was still hot without life, while staying above it all along. Ironically,
the formation of ocean and continents had a stabilising effect.
The brown area is the amount of continent relative to today (%) and
the light blue area the relative amount of sea. The grey area shows the
temperature of the atmosphere from the surface (top) to the 'average' seen
from space. The red curve shows the solar irradiation relative to today
(%).
Note that Earth's hot interior has also been cooling and that the amount
of heat lost through its crust (and through volcanism) must have been diminishing
noticeably (not shown). Today, heat loss from the interior is estimated
at 0.1 W/m2, or 0.01% of incoming sunlight. Even so, there are places where
thermal energy can be exploited.
Minik T Rosing, Dennis K Bird, Norman H Sleep, Christian
J Bjerrum (2010): No climate paradox under the faint early Sun.
Letter to Nature 464, 744-747.
The diagram contains information from Kasting &
Catling (2003) and the accretion of Earth's crust.See soilgeo/crust
formation.
Variable solar
activity This
diagram brings three factors together: sun spots,
carbon-14
ratio and average temperature. Note
that the scale of C-14 is upside down. Carbon-14 is produced by normal
nitrogen-14 absorbing a low-energy ('thermal') neutron and releasing one
hydrogen ion in the upper atmosphere:
1n + 14N => 14C + 1H
Carbon-14 is radioactive and decays (beta radiation of electrons) in about
5700 years to half of its radioactivity, and can thus be used for carbon-dating
of biomatter like wood, bone and shell. But it occurs in trace amounts
of trillionths (1E-12) in the atmosphere. Shown here is its variation over
time. Note that recently natural C-14 has been polluted by nuclear tests
(making lots of it) and fossil fuel burning (lacking it). The brown curve
shows that solar activity has been changing over time, and that it bears
some correlation with surface temperature. However, it varies for only
a few percent over long time scales.
In the recent millennium two climate periods stood
out: the warm Medi-eval Warm Period (MWP), during which Vikings
roamed the seas and Greenland was inhabitable, and the cold Little Ice
Age (LIA 1350-1850), when the Thames froze over and Europe suffered
famines and emigrations (to the USA).
In recent times more attention is paid to the
number of sunspots counted on the sun's surface facing us. It also shows
that the sun is restless. Particularly long periods of low sunspot numbers
are correlated with cold periods in the world's climates. Not shown on
the diagram is the very recent drop in sunspot numbers and their unusual
extended absence. At the same time, cold winters are experienced. We may
be in for another little ice age and hopefully not a full ice age. See
the
restless sun, further down.
minimum
duration
what happened
Dalton
1790-1820
crop failures, mass migration
to USA;
Maunder
1645-1715
more severe than Dalton;
Imperial colonisation; Thames freezes over;
Spörer
1450-1550
collapse of Machu Picchu
civilisation in Peru
Wolf
1280-1350
begin of Little Ice Age
Oort
1040-1080
dark middle ages; pests
and famines
Mayan
600-800
collapse of Maya civilisation
Greek
350-450BC
collapse of the Greek civilisation
Homeric
650-750BC
.collapse of the Minoan
(Crete) civilisation (?not sure)
Egyptian
1500-1400BC
collapse of the 18th Egyptian
Dynasty
Imaginary
atmospheres In
order to deepen our understanding of how Earth's actual atmosphere works,
we'll study a number of imaginary atmospheres, but first the glasshouse
experiment (Robert W Wood 1909, Businger [1]). It is a simple experiment
with three well insulated identical boxes A, B, C. A is open. B is covered
in glass which lets light through but which blocks infrared light. Most
glasses do this. C is covered with a special window made from salt (NaCl)
which is known to be transparent to both light and infrared. Many plastics
do this too. After exposure to sunlight, container A remains a little warmer
than outside but the covered containers warm up considerably, reaching
identical high temperatures of 55ºC with "hardly a degree difference".
If the greenhouse effect were caused by blocking infrared radiation, container
B would have become much warmer than C. In fact C becomes a little warmer
because glass still blocks a little of the incoming solar infrared radiation.
When the experiment is left to cool, the cooling rate is determined by
the thickness of the glass. Conclusion: at Earth's temperatures and air
densities, outgoing infrared radiation is negligible compared to conduction
and convection. The greenhouse effect is not caused by infrared-blocking
gases. Later we'll come across other reasons why this is so. The experiment
has also been replicated by others [2] and with balloons [3] and very thoroughly
here.Nevertheless,
a large number of 'authorities' make false claims about this as it has
become an entrenched belief [7]
At mid-day, a fully insulated box as above would receive
1368W/m2 solar radiation to reach a temperature of (Stefan-Boltzman law):
T = {1368/0.000000056704}^0.25 = 394.1K = 121.0ºC. Thus Earth can
never become this hot.
Ramanathan and Coakley pointed out in their 1978 paper: "convection
is what determines the temperature gradient of the atmosphere but solving
the equations for convection is a significant problem so the radiative
convective approach is to use the known temperature profile in the lower
atmosphere to solve the radiative transfer equations."
In other words, an oversimplification of the real physics, and an acknowledgement
of the importance of conduction and convection. The temperature profile
is not calculated and explained, but is used to bolster the (false)
radiative transfer theory, also in use by the IPCC.
Nasif S Nahle: The warming effect (misnamed "the greenhouse
effect") of Earth is due to the oceans, the ground surface and subsurface
materials. Atmospheric gases act only as conveyors of heat. We
concur.
Ångström's experiment (1900) showed: 1.
CO2 is transparent to 90% of infrared radiation applicable to temperature
variation. 2. Those infrared bands that CO2 readily obstructs are already
almost totally blocked by atmospheric CO2.
NASA: Certain gases in the atmosphere behave like
the glass on a greenhouse, allowing sunlight to enter, but blocking heat
from escaping (false). This is the whole
(false) basis for the IPCC models. See also Hall
of Shame/realclimate. Many textbooks repeat this argument. How
could so many scientists have been so wrong for so long?
[1] R.W.Wood from the London, Edinborough and Dublin Philosophical
Magazine, 1909, vol 17, p319-320. Cambridge UL shelf mark p340.1.c.95,
i
link: http://www.tech-know-group.com/papers/Note_on_the_Theory_of_the_Greenhouse.pdf [2] Nasif S Nahle and John O'Sullivan confirm Robert
Wood's experiment, quoted in Chapter6.
link(PDF).
[3] Berthold Klein's experiment quoted in Chapter6.
[4] Alan Siddons (March 2010): The Hidden Flaw in
Greenhouse Theory, http://www.americanthinker.com/2010/02/the_hidden_flaw_in_greenhouse.html
[5] Gerhard Gerlich and Ralf D. Tscheuschner (2009):
Falsification
of the Atmospheric CO2 greenhouse effect within the frame of physics,
International Journal of Modern Physics B, Vol. 23, No. 3 (2009) 275{364
}.
[6] Postma Joseph E (): copernicus meets greenhouse
effect. link.
explaining two important mistakes in our thinking. Greenhouse
effect cools rather than warms.!?
[7] John O'Sullivan (2012): Our Atmosphere Like a
Greenhouse: 53 Crass Authority Statements. link.disgusting.
Important points:
the glasshouse experiment cannot be explained
by the IPCC's theory of greenhouse warming by radiation and back-radiation.
there exists scientific confusion about radiation
and netto energy flow (heat transfer).
the world does not receive 'average' sunlight
but is warmed on one side, as the other side cools.
conduction and convection dominate in the lower
troposphere and what happens above cannot influence what is below.(heat
flows upward)
there is still a small amount of radiation that
originates from the surface and reaches space.
"greenhouse gases" can not, have not and will
not have any measurable effect on temperature. (confirmed further below)
the IPCC models are wrong. (see Tscheuschner's
bold statements in Chapter6)
Absence
of an atmosphere The leftmost picture is that of Earth without an atmosphere, a bit
like the moon, but with the presence of a warm inner earth (magma) and
a crust above it. Earth's crust is by itself a magnificent blanket, only
20-40km thick compared to the magma which goes 6300km deep. Of course,
this is all very simplistic. In the absence of an atmosphere, the incoming
radiation is either reflected back into space from light coloured areas,
or is absorbed to heat the surface of the crust. The red and purple bands
signify some infrared and ultraviolet in the incoming radiation. The amount
of infrared re-radiated into space is proportional to the temperature of
the surface, reason why it cools rapidly by night. On average, the temperature
is as low as it can get (-17ºC). The cold crust pushes the magma further
down, allowing only a trickle of heat through. Note that a dead planet
has high reflectivity (albedo), not shown. Note also that the crust acts
as a miniature atmosphere by storing and conducting some heat. The 'centre'
of this 'atmosphere' lies underground.
Nitrogen atmosphere A nitrogen atmosphere is chosen as an example of an atmosphere which
does not absorb radiation and is completely transparent to both incoming
and outgoing radiation. It is just a cushion of gas resting on the crust.
The amount of light re-radiated is the same as before, depending on the
colour of the (dead) crust. But this kind of atmosphere has mass and contributes
to conduction and convection by which warm air rises as cold air sinks.
Also surface winds help to spread the heat more evenly. Thus heat is spread
over the atmosphere without escaping. Such a blanket spreads the temperature
more evenly and it also moderates extremes from day to night. The warm
atmosphere then re-radiates most infrared from higher altitudes. As a result,
the surface of the crust becomes warmer on average (5ºC). This invites
the crust to warm through, as if the magma rose somewhat but this is inconsequential.
Convection or re-radiation? There exists a great deal
of confusion about how the warmth of the planet is reradiated to space
and how the greenhouse effect works. It is thought that water vapour, carbondioxide
and a few other heat-trapping gases control Earth's temperature. But a
pure, transparent nitrogen atmosphere without them, does (almost?) the
same. We think that our atmosphere is different from a greenhouse, but
it is not. The troposphere is 'capped' like the glass on a greenhouse,
by the adiabatic lapse rate which is independent of whichever gas
is inside.
It is thought that the skin
re-radiates out to space through the transparent air, according to its
temperature and the Stefan-Boltzman equation (above),
but this is not so. Reradiation can occur only from a warmer to a cooler
body, and happens at a rate depending on the difference in temperature
between the two bodies, to the fourth power (Twarm ^4 - Tcold ^4).
For example, a warm 30ºC
skin reradiating to a 10º cooler air above it (exceptional case),
radiates heat proportional to 300^4 - 290^4 = (81 - 71)E8 = 10E8, whereas
reradiating to space which is 300º cooler, loses heat proportional
to 300^4 = 81E8 or 8 times faster. With small differences in temperature,
as is the case in air, re-radiation to space becomes negligible [1].
It is also important how
'easy' it is to cool the skin by warming the gas above it, compared to
re-radiation, as water vapour plays also a very important role [1].
The consequence of this
is that re-radiation plays a very small role inside the atmosphere, as
long as it remains dense enough. But in the stratosphere, reradiation
does more to cooling than convection.
In the troposphere and between
skin and air, heat is (mainly) transferred by contact (conduction) and
by movement (wind, convection), and within this moving air, by evaporation
and condensation of water. Air movement happens both horizontally and vertically.
Ironically, the radiation-trapping
gases like CO2, and even water VAPOUR play almost no role. However,
water
vapour's latent heat and condensation into cloud, rain and snow, are of
utmost importance to Earth's greenhouse effect.
Conduction and convection Air
is a paradoxical substance. When you are standing in a freezing gale, the
wind is trying to freeze you while at the same time the air in your clothing
is keeping you warm. Why? Air (nitrogen and oxygen) is an excellent insulator
for heat when it is not allowed to move, such as in woollen clothing. But
once it moves, it becomes a good conductor of heat. Why?
The diagram attempts to illustrate this. It has four layers of different
temperatures, illustrated by different shades of red. A cubicle A
is sandwiched between two layers. As it receives heat from the warmer layer
below, it passes an equal quantity of heat to the cooler layer above, but
it cannot exchange heat with the layer it is located in because it has
the same temperature. It is a slow process caled conduction.
If the cubicle moves to a layer of lower temperature, it will pass twice
the quantity of heat to the next cooler layer, while at the same time also
passing four quantities (it has four sides in this layer) of heat to its
present layer. The same happens in reverse, when a cubicle
B enters
from a cooler to a warmer layer. Thus by moving around, which is named
convection,
air becomes many times more effective in conducting heat. It so happens
that windy days are more common than calm days, and every wind also has
much turbulence. Also warm air rises as cold air sinks. Thus convection
is a major influence on the distribution of heat.
Note that this applies to every kind of gaseous atmosphere on any planet.
The mysterious lapse rate Above we saw that the troposphere is capped by the tropopause and that
the temperature diminishes at a constant rate (the lapse rate) of
-6.49ºC/km, despite the fact that the air becomes progressively thinner.
It is strange that the temperature diminishes linearly (at constant rate)
with altitude. So there is loss of heat, but not at a constant rate because
the air has progressively less heat content. Then suddenly at 10-12km
altitude, the loss of heat becomes zero (lapse rate = 0), which
means heat is neither coming in, nor going out. Stranger still, from here
on into the stratosphere, the very thin air becomes warmer, which means
that heat is coming in.
The lapse rate is poorly understood, even though it is a general property
of gaseous atmospheres. Some think that it is caused by air rising and
cooling while it expands (adiabatic cooling), but up there exists
no spare space for rising air, and for every parcel of air rising, there
must be a corresponding parcel of air sinking, accompanied by counter-acting
adiabatic
warming. Every time a parcel of air warms or cools, some heat is lost
permanently due to thermodynamic losses. Is the heat transferred
upward by convection, and is the air moving ever faster as it becomes thinner?
Or is most of the heat re-radiated across the tropopause into space? Evidently
there is much uncertainty here.
Important points:
a totally inert, transparent atmosphere without
any greenhouse gases achieves most (if not all) of the greenhouse effect:
an atmospheric blanket capable of storing heat
and redistributing it
a troposphere and a stratosphere with similar
pauses and lapse rates - a controlled out-radiation
winds distributing heat effectively from equator
to poles and back
vertical convection transporting heat while warming
the entire atmosphere
this imaginary atmosphere does not contain water,
nor life, resulting in:
higher albedo because there are no oceans nor
forests and plant life (cooler)
lower albedo because there are no clouds nor ice
caps (warmer)
lower infrared absorption because there is no
water vapour (cooler)
CO2 atmosphere The two diagrams
show a CO2 atmosphere at Earth's conditions (low concentration with nitrogen)
and the situation on Venus. CO2 has only little effect on the incoming
radiation and some effect on the outgoing radiation. At 300ppm it is already
almost fully opaque ('black') for the wavelengths it blocks, within one
metre! Within a few metres it has stopped all the infrared it could possibly
stop, and converted this energy to heat, radiating again over a wide spectrum
in all directions. In other words, CO2 mainly contributes to convection.
In the upper atmosphere an increase in CO2 concentration (say, from 400
to 800 ppm at the surface) could have an effect, but there's little it
can do here because all the radiation it could absorb has been absorbed
and retransmitted at other wavelenghts. Besides, the cooler air here cannot
warm the warmer air below it. The situation on Venus which is surrounded
by almost pure CO2, is entirely different for other reasons.
Note that much ado is made about CO2 as a greenhouse gas, supported by
model calculations, but actual measurements do not support this. CO2 is
just far too potent to have any effect left [1]. At this point it is important
to remember that CO2 cannot ever have a measurable effect on temperature,
despite what has been published to the contrary. We'll come back to this
later.
A computer simulation program MODTRAN (not an
experiment), assuming that there still exists infrared emissions in the
CO2 band, from the stratosphere, leads to a similar but weaker conclusion:
"The effect of carbon
dioxide on temperature is logarithmic and thus climate sensitivity decreases
with increasing concentration. The first 20 ppm of carbon dioxide has a
greater temperature effect than the next 400 ppm. The rate of annual increase
in atmospheric carbon dioxide over the last 30 years has averaged 1.7 ppm.
From the current level of 380 ppm, it is projected to rise to 420 ppm by
2030. The projected 40 ppm increase
reduces emission from the stratosphere to space from 279.6 Watt/m2
to 279.2 Watt/m2. Using the temperature response demonstrated by Idso (1998)
of 0.1°C per watt/m2, this difference of 0.4 watt/m2 equates to an
increase in atmospheric temperature of 0.04°C. Increasing the carbon dioxide
content by a further 200 ppm to 620 ppm, projected by 2150, results in
a further 0.16°C increase in atmospheric temperature." [2]
Another way of looking at carbondioxide's impotence
is: it occupies less than 0.001 of air. Suppose it was 'black' to outgoing
infrared radiation, only 1 of the air would be heated. The heat is then
passed on to the other 999.
Gerhard Gerlich (2009) [3]: "within CO2's absorption wavelength
of 10µm in air with 300ppmv CO2, one finds 8 million CO2 molecules.
To talk of heat transfer as done by radiation is nonsense. Conduction and
convection dominate by far. CO2 conducts heat only
half as well as either O2 or N2."
Gerhard Gerlich (2009) [3]: (freely translated) "there exists
no mechanism whereby carbon dioxide in the cooler upper atmosphere exerts
any thermal 'forcing' effect on the warmer surface below. To do so would
violate both the First and Second Laws of Thermodynamics ... heat rises,
it does not fall."
Alfred Shack (1972): "the radiative component of heat transfer
of CO2 ... can be neglected at atmospheric temperatures. The influence
of carbonic acid on the Earth's climates is definitely unmeasurable."
Important points:
all physics principles point to the same conclusion:
greenhouse gases and CO2 have no measurable influence on Earth's temperature.
heat transfer in the troposphere happens mainly
by conduction and convection
[1] Hug, Heinz (1998): The climate catastrophe
- a spectroscopic artefact?. http://www.john-daly.com/artifact.htmA
simple spectrometric measurement on a column of air with variable amounts
of CO2. CO2 is just too strong an absorber of infrared to have any effect
on AGW, which makes it just part of convection. One simple experiment that
proves many theoretical considerations wrong.
[2] Archibald, David (2008): Solar Cycle 24: Implications
for the United States. International Conf on Climate Change, March
2008. link.
[3] Gerlich, Gerhard & Ralf D Tscheuschner (2007):
Falsification
of the atmospheric CO2 greenhouse effects within the frame of physics.
In J Modern Physics Vol 23, 3 275-364. link.
Very
important reading but a bit difficult. It completely demolishes the greenhouse
effect as propagated by the IPCC and most textbooks. Any gaseous atmosphere
has a greenhouse effect. This paper has caused quite a stir among climate
scientists. An easier to read 6-page
summary by Hans Schreuder, 24 June 2008.
+
Venus' atmosphere Venus is totally different from Earth with its much bigger atmosphere.
The atmosphere there is some 90 times denser, which conveys heat even more
so by convection (this is not so on Earth). In addition, its outer layer
consists of white sulfurdioxide (SO2) which reflects incoming radiation
by over 65%. Whatever light penetrates further into the atmosphere, is
absorbed until a very dim light reaches the crust. The very dense CO2 atmosphere
supports fierce convection of gas, distributing heat effectively. Because
of its isolating blanket, Venus' interior has remained warmer than Earth's.
As a result, its crust conveys much heat from its interior to its very
dense atmosphere. The surface temperature on Venus is some 470ºC.
How does Venus differ from Earth?
it is slightly smaller than Earth (-10%), volume (-14%), mass (-18%)
it orbits closer to the sun (27%), which suggests 60% more incoming radiation
(actual 90%)
it has a reflective layer of sulfurdioxide (SO2) reflecting 65% back to
space, leaving its effective irradiation at about the same as Earth's
if Earth were at Venus' position, its temperature would be 1.9 * 300ºK
= 570ºK ~ 300ºC, and all oceans would have boiled off to space
it radiates out forty times more energy than it receives from the Sun,
as is indicated by the data from the Magellan Sonde between 1990 and 1994
(Broad, W.J. 1996) and confirmed by the Pioneer and Vega missions. This
suggests that Venus' surface is 'young' and likely still thin and that
this heat comes from its interior.
its atmosphere is almost pure CO2 (96%) compressed and heated to the extent
of becoming super-critical, like a liquid gas ocean over the entire
planet [1].
its atmosphere is very much thicker and heavier than Earth's (90 times
surface pressure, 500 times heavier) whereas CO2 is only 60% heavier than
nitrogen [1].
Earth's surface pressure of 1 bar is found at 49.5 km height
a Venusian day (spin) is 243 days but a Venusian year (around the Sun)
is only 225 days. Thus a Venusian day is longer than a Venusian year.
it has no plate tectonics (moving parts of its crust)
it has a smooth surface: only about 900 impact craters, which means that
its crust has congealed only recently, and is therefore rather thin with
much volcanic activity
it has no oceans and never had them (its crust is likely to be of even
thickness)
it has cooled less than Earth and its mantle may be much hotter, and its
crust much thinner (not proved)
it spins the opposite way, which is rather strange, but is irrelevant to
its temperature
Important points:
Venusian high temperature climate is not caused
by a runaway CO2 green house effect as popularised by Carl Sagan (1960),
followed by a "runaway greenhouse effect" postulated by S. I. Rasool and
C. de Bergh in 1970, which fuelled James Hansen's (NASA/IPCC) belief that
Earth faces a similar fate (1980s) and which has become the dogma of the
present-day fear of catastrophic global warming (IPCC) with an 'irreversible
tipping point'.
Venus is not Earth's "sister planet" but is entirely
different and strange.
Venus emits much more heat than it receives (fact).
[1] It is rather counter-intuitive that a gas (CO2)
which is only 60% heavier than air (N2 + O2), over a planet slightly smaller
than Earth, and with 20% less gravity, contributes to an atmosphere which
is 90 times denser than Earth's. Add to that its higher temperature, which
means that gases are more prone to be 'vented' (lost) to space. This paradox
has been explained by Dr Hartwig Volz, and is accessible here: The
significance of Venusian climate.
[2] Venus isn't our twin! April 2006 http://www.holoscience.com/news.php?article=9aqt6cz5
CO2
has no influence on the greenhouse effect Harry
Dale Huffman [1,2] discovered that at Earthly tropospheric pressure (sea
level 1000mBar to 200mBar at the top of the troposphere), the temperature
gradients of Earth and Venus are identical as shown by this graph (Earth
blue, Venus purple). Horizontally the tropospheric pressure from the surface
up, and vertically the temperature, corrected by 1.176 because Venus is
closer to the sun [1]. So an atmosphere with almost 100% CO2 behaves identically
to one with almost 0%!!! Likewise, an atmosphere without any water vapour
(Venus) behaves like one half saturated in it (Earth).
This
has a number of very important consequences:
'greenhouse
gases' have no influence on the 'greenhouse effect'. Thus methane, carbon
dioxide and even water vapour have no effect on how heat escapes from a
planet with a gaseous atmosphere.
the
tropospheric temperature gradient or lapse rate (=the real greenhouse effect)
is caused by thermodynamic behaviour of any gas, combined with conduction
and convection.
Anthropogenic
Global Warming from CO2 is not possible !!!!
the
importance of this fact cannot be overstated. Take note!
Nitrogen
atmosphere with water Adding
water to the nitrogen atmosphere discussed above, changes the picture quite
radically as two very reflective substances are added: ice caps and clouds.
Of these the ice caps store a very large amount of latent heat (coolth),
changing in size only slowly. By comparison, clouds are ephemeral
(short-lasting). In addition, convection with water vapour is much more
effective because water vapour has high latent heat and condenses
at altitude, raining down rapidly, and thereby conveying heat upward and
cold downward. Even though air contains only 2-3% water, its ability to
convey heat and cold increases considerably. See also our next chapter
on water and ice. The large ocean however, is
by far the largest circulating store of heat, moderating Earth's temperature
through day/night and seasonal temperature swings and even in between ice
ages.
Water has given our planet an ability to regulate its temperature in
the following ways:
warming => more evaporation => more cloud => more light reflected
=> cooling
However, a small positive feedback may occur, feared by some to become
a 'run-away' self-reinforcing loop:
warming => more water vapour => traps infrared light => stores heat
in atmosphere => more warming
But we now understand that water VAPOUR does not play a role in the
radiation budget for the same reasons that CO2 doesn't.
In addition:
cooling => less moisture in air => less snowfall => shrinking ice
caps => less light reflected to space => warming
But also runaway cooling:
cooling => more ice extent => more reflected light => more cooling
Please note that the respective magnitudes of the above four effects
are not known, which lies at the centre of the global warming scare. But
there is more to the planet's self-regulation as we will see below.
The most important thing to remember is that water vapour, an innocent
potential warming gas, can instantaneously become cloud, a potent cooling
agent. With about 20% of incoming radiation reflected by cloud, the
planet has a very powerful 'throttle' to control its temperature. For instance,
in the morning when the sun is weak, clouds disappear and as the earth
warms, water vapour enters the air. By mid day clouds begin to form, just
as the sun is becoming hot, resulting in moderation of incoming heat and
retention of heat between cloud and skin. For the surface to become cooler,
clouds simply need to begin a little earlier in the day. A similar thing
can happen at night where a cloudless sky loses more heat.
When a cloud forms, a large amount of heat is freed, warming the cloud
as it forms, but not enough to re-evaporate it. Thus clouds also act like
blankets. A dense cloud reflects more light, before it can be absorbed
by the water in the cloud (water also absorbs light, see underwater
photography/light). Clouds keep the surface cool by day and warm by
night.
Snowball Earth Snowball Earth refers to the hypothesis that the Earth's surface became
nearly or entirely frozen over, at least once during three periods between
650 and 750 million years ago (the Pre-Cambrium), because glacial deposits
were found in sediments located rather far from the poles, as shown on
the map below of what is thought to be the location of the continents at
the time. [image Wikipedia] See also Geologic
time table
The idea that it could have been possible that the entire planet was
covered in ice and snow, comes from:
cooling => more ice extent => more reflected light => more cooling
and conversely:
warming => less ice extent => more absorbed light => warming
but also:
cooling => less evaporation => less ice => warming
and Earth may well teeter in the balance between ice formation and evaporation,
with oscillations between each phase (ice ages).
Off course the hypothesis is shrouded in uncertainties related to the
nature of sediments found, their magnetic orientation, transport of glacial
debris, location of continents, and so on. For understanding present climate,
it is sufficient to understand that glaciation can cause more glaciation
in a run-away effect such as an ice age, and that ice ages last longer
than their warm interglacials. See chapter2/ice
ages.
For an extensive treatise see Wikipedia/Snowball_Earth.
- a lot of wild speculation.
Temperature
regulation by a living planet It is too tempting to consider the Earth's temperature and climate
regulated by physical non-living factors. But life on Earth has existed
for a very long time, changing its environment gradually to suit itself.
So life has co-evolved with the climates it created, on the one hand adapting
to the existing climate, and on the other hand improving it.
Daisyworld Independent scientist James Lovelock and Andrew Watson in a paper published
in 1983 [1], first suggested the idea that life and climate evolved together,
the one influencing the other, in such a way that the planet can be thought
of as a single organism, even though it is made up of millions of species.
For if life did not evolve this way, it would have remained very primitive
indeed. Daisy World illustrates the idea.
Suppose
the world is mainly barren, with a patch of black daisies and a patch of
white daisies of the same species. Because black daisies absorb more heat,
they can live in the colder parts of the planet, while the white daisies
live in the warmer parts, reflecting more light, and making these parts
more inhabitable. The word will soon be covered in black and white, and
grey in the area where both survive, as shown in the left image.
Suppose the sun becomes hotter. This makes the grey area less suitable
for black daisies and they retreat to the poles, as white daisies take
over, spreading from the equator. The effect is that more sunlight is reflected
back into space and that the overall temperature of the world stays much
the same, which is indeed borne out by computer simulations.
In the same theme, deserts could be stabilising the climate as follows:
warming => more desert, less green => more light reflected to space
+ more night cooling => cooling
Alas, during an ice age the CO2
concentration in air reduces and life becomes rather desert-like, which
adds to the ice age effect (see climate chapter
2)
The difference in life on Earth, between an ice age and
what it is today, is massive. Then the world was mainly desert and grassland.
The
problem with Earth is that its albedo is rather the opposite of Daisyworld,
as shown in this image from the CERES satellite. Thus daisyworld cannot
counteract the ice age drivers:
more ice => cooler => more ice cooler => less CO2 => more desert => cooler
which is why Earth is stuck in a multiple million year epoch of repeated
ice ages (see Chapter2/ice ages) and
why Earth's temperature has been gyrating long before that. Read our carbon
pipe hypothesis in the ocean acidification chapter.
This temperature graph obtained from sediment cores,
shows that the climate on Earth has become progressively less stable.
[1] Watson, A J & J E Lovelock (1983): Biological
homeostasis of the global environment: the parable of Daisyworld. Tellus
B (International Meteorological Institute) 35 (4): 2869.
[2] Lovelock, James E (1987): GAIA, a new look at
life on earth. Oxford University Press.
[3] See Wikipedia/daisy_world.
[4] Schneider, Stephen H and Randi Londer: The Co-Evolution
of Climate and Life. 1984
Dimethylsulfide and climate James
Lovelock, in trying to find the circulation of sulfur from sea to land,
discovered and measured the molecule dimethylsulfide DMS (CH3-S-CH3), produced
by plankton [1,2]. Although much bigger than the water molecule (H-O-H),
it has a similarly polarised form, which attracts water molecules. Because
water molecules are already attracted to one another, dimethylsulfide acts
as a condensation nucleus, assisting water to change into cloud.
The diagram shows how the plankton releases DMS which attracts water
to form cloud. The diagram also shows how excessive erosion and wasteful
land use (over-use of fertilisers) could accelerate cloud formation and
produce denser rains, leading to more erosion, etc. (which is not proved)
Scientists claim that DMS first needs to be oxidised to sulfuric acid
before it can act as a condensation nucleus (which is not proved). The
concentration of DMS in the sea is rather low (2-4 nanoMol/litre).
DMS could be involved in stabilising world temperature by stabilising plankton
productivity:
more light => more plankton => more DMS => more cloud => less light and also:
warming => faster growth of plankton => more DMS => more cloud =>
cooling
also:
more people => more intensive land use => more run-off more runoff => more plankton => more DMS => more and heavier rains
=> more run-off
Reader note that this is still an area of speculation as the behaviour
of DMS and other cloud condensing substances is not known in very low concentrations.
[1] DMS has been associated with various plankton organisms
such as coccolithophores, but it may well be that DMS is not produced during
photosynthesis by the phytoplankton, but by bacterial decomposition especially
of short-lived phytoplankton. [our hypothesis, J F Anthoni]
[2] Charlson R J, Lovelock J E, Andreae M O, Warren S
G (1987): Oceanic phytoplankton, atmospheric sulfur, cloud albedo and
climate. Nature 326: 655-661. http://www.nature.com/nature/journal/v326/n6114/abs/326655a0.html.
[not free]
[3] See Wikipedia/dimethyl_sulfide:
DMS is insoluble in water and boils at 37ºC, yet it is produced in
water by life. In the atmosphere it is oxidised to sulfur compounds that
form cloud condensation nuclei (CCN)
[4] Timothy Bates, Patricia Quinn, Derek Coffman, Drew
Hamilton, James Johnson, & Theresa Miller: Oceanic Dimethylsulfide
(DMS) and Climate. http://saga.pmel.noaa.gov/review/dms_climate.html
: DMS concentrations in the ocean are not changing, steady at around
3nM (~0.2ppm). World-wide measurements of DMS emissions and concentrations
are now in progress.
Land use
and climate change The
effects from land use on climate, have not had extensive coverage, and
they do not feature in IPCC climate change models either. However, the
effect of changing a forest cover into arable lands, and the building of
cities, houses and roads, has had a major effect on climate and is still
continuing as world population grows. Once upon a time, the lowlands
near ocean coasts were lush forests and swamps. Moisture from the oceans
(all rain comes from the sea) would rise and cool above the lowlands, and
the rain would be sponged up by forests and deep soils. The forests in
turn would re-evaporate moisture only to fall as rain further inland, and
so on. In the end, even the central deserts of the continents would get
some rain.
But urbanisation and cropland changed all that. Cities and roads do not
sponge up water at all, but drain it straight into local rivers, back to
the sea. Cropland has lost the deep forest soils and standing lush foliage,
and can store only a small amount of moisture, and excess water immediately
drains away into rivers, back to the sea. As a result, the midlands and
highlands receive significantly less water, resulting in droughts, expanding
deserts, empty aquifers and shrinking glaciers. All are symptoms of major
change in climate, keeping pace with world population [1,2].
more people => less forest => less re-evaporation => drier continents
=> more light reflected => cooling but
less cloud => warming
Thus ironically, the ultimate effect of land use changes is unpredictable
even though its symptoms have been associated with 'global warming':
expanding continental deserts: less moisture reaches the centres
of continents, where deserts have always been.
shrinking land-locked glaciers: less snowfall on glaciers.
diminishing river flow of highland tributaries (river branches)
but increased flow in lowland rivers (50-100 times).
lowland floodings because water returns too rapidly, rather than
being sponged up by lowland forests. Also sediment build-up in the lowlands,
blocks river flow.
droughts and crop failures; abandonment of cropland, particularly
inland. To keep up with population, more and more marginal lands are cultivated.
Located more to the centres of continents, these lands receive less moisture.
shrinking aquifers and wells fed by ground water: aquifers are refilled
by rains and drained by agriculture. They shrink because increased usage
is accompanied by less precipitation.
increased water loss from lakes, especially high altitude lakes.
Lakes are filled by rain, and less moisture reaches the highlands, causing
water loss.
hotter cities (Urban Heat Islands UHI): cities with their concrete
and asphalt, lacking vegetation, do not re-evaporate moisture and become
very warm. This causes air to rise high, containing little moisture.
warmer days and cooler nights, which is mainly uncomfortable during
the day, experienced as warming.
higher cloud level and less moisture, affecting mountain forests
and mountain glaciers.
reduced heat transfer from equator to poles as the air over land
contains less moisture.
changing wind patterns, adapting to the above, for maximum heat
transfer with less moisture, or changing winds to areas with more moisture.
changing precipitation patterns.
Reader please note that this huge climate factor (land use change) has
not received enough attention by mainstream scientists. Also that it is
too difficult to simulate in computer models [3].
[1] Wilhelm Ripl: Management of water cycle and energy
flow for ecosystem control. 1994.
[2] Wilhelm Ripl, Christian Hildmann (1994): Wasserhaushalt
und Basenverluste aus der Landschaft.... http://www2.geographie.uni-halle.de/raum_umw/team/Hildmann/LITERA/lit_9402.htm
(in German) Water and energy drive all life processes. Energy occurs as
'alternating current' in daily and seasonal cycles, the properties of which
have been under-rated. In the past 2 millennia, the water storage capacity
of the land has been reduced considerably, with consequent losses in soil
quality and quantity. Also resulting in flooding. Next phase could be universal
desertification.
[3] Wilhelm Ripl, freshwater scientist (limnologist)
at the Technological University of Berlin, is highly critical of the IPCC
computer models because the most important factor on climate change, the
change in land use, is not even looked at.
Earth's atmosphere
and energy budget As seen from our imaginary atmospheres, just about any atmosphere has
a tempering 'greenhouse' effect on Earth's temperature, while acting like
a blanket. The collective name for these effects is the greenhouse effect
but a better name would be atmospheric effect.
It is generally thought (IPCC) that the gases in Earth's atmosphere block
outgoing radiation, such that the atmosphere heats up (which is easily
proved false by experiment). The diagrams below may illustrate the problem.
Diagram from Wikipedia (above) and NASA (on right). One
has average heat fluxes in Watt per square metres, the other gives relative
values. But conduction and convection (rising air) hardly play a role.
Earth's radiation budget according
to Kiel & Trenberth The
diagram shown here is perhaps the most detailed available today (Kiel &
Trenberth). All quantities in W/m2. Average incoming radiation is 342 of
which 76+29 (31%) is immediately reflected back and 10+58 (20%) absorbed
by the atmosphere, leaving 29 (8%) reflected by the surface and 169 (49%)
absorbed. Heat convection by air and water vapour 22+76 (29%) heats the
lower atmosphere (troposphere). The surface radiates 392 out but receives
321 by back radiation 392-321 (21%). Of this 71, 53 (15%) penetrates the
troposphere, etc. etc. Finally 237 (69%) leaves the planet as infrared
radiation. Note that the 'atmospheric window' (surface to space) for infrared
is a mere 40 (12%) and that highly variable clouds account for 76 (22%).
This diagram also appeared in the IPCC AR4 report, and the name Trenberth
is exposed through climategate. Take care, for the nonsense can be clearly
seen as follows:.
Absorbed by the surface: 196. Re-emitted by the surface 392. This is
not possible because energy transfers within a passive closed system cannot
exceed the energy entering the system. Thus a surface cannot re-emit
more than it gets. In the diagram it re-emits even more than the total
energy from the sun (342). Also the idea of back radiation is false because
it comes from a cooler source, higher up in the atmosphere. One cannot
get more back radiation than what was absorbed by the surface and the atmosphere
(169+58). The whole diagram is guess work or fantasy, not based on actual
measurements, and all global climate models are based on it!
No part of the 'global energy budget'
can be greater than the incident energy. - Harry Dale Huffman link
A
diagram from Wallace & Hobbs in the late 70s. Note how these figures
disagree with those from other authors. The science of the radiation budget
is far from settled, but there is another problem - these figures are not
constant, but vary enormously from place to place, year to year, season
to season, day to night and so on. The fear of manmade global warming comes
from the notion that, all things remaining equal (which is not likely),
increasing levels of CO2 will alter the energy budget such that more heat
stays in the atmospheric 'blanket'. For that to happen, we need to look
at the radiation absorption of CO2 and other greenhouse gases.
The incoming radiation is bounded by the red bell curve for
5525K, the temperature of the sun. What reaches Earth is shown as the ragged
red shape. A large part of the UV side of the bell won't reach the surface
because it is filtered out by oxygen and ozone, and by interacting with
atmospheric molecules, the light is scattered in all directions (Rayleigh
scattering), reason why the sky looks blue. Water vapour also halts some
of the infrared incoming light, which one can feel varying on a sunny day.
What the Earth radiates out is shifted to the right by
an amount accounting for the difference between 5525K and about 300K. The
purple, blue and black bell curves show how much uncertainty exists about
how warm Earth seems as seen from space (210 to 310K or 100ºC uncertainty
!!). Important is that only 15-30% gets through the greenhouse blanket.
Note that the wavelength scale is logarithmic and the blue curve and shape
should be very much wider on a linear scale. So the blue shape should be
identical in size (surface area) to the red shape.
However, it is important to notice that nitrous oxide,
methane and oxygen have only a negligible role to play, as their spectra
mostly overlap those of water vapour. CO2 weighs in at second place, but
where it is effective, it is nearly 100% effective in the first 10 metres,
so any increase will have very little effect. Thus water vapour and clouds
are the great variable in the climate equation, far outweighing any incremental
effect of the rather constant CO2.
Note (blue curve) that the atmosphere is relatively transparent
to IR radiation from 8-13 µm, which is commonly used for IR imagery
and meteorological satellites.
Atmospheric data
Solar irradiation
Increase since 18th century
Average for day/night, season
& location
Lapse rate (cooling with
altitude)
Height of troposphere (mixed
sphere)
Mean surface temperature
Density of air at sea level
is about
pressure decreases by a factor
of two approximately every 5.6 km
50% of the atmosphere by mass
is below an altitude of 5.6 km (18,000 ft).
90% of the atmosphere by mass
is below an altitude of 16 km (52,000 ft).
99% of the atmosphere by mass
is below an alitude of 30km
The common altitude of commercial
airliners is about 10 km (33,000 ft) and Mt. Everest's summit is 8,848
m (29,029 ft) above sea level.
99.99997% of the atmosphere
by mass is below 100 km (62 mi; 330,000 ft), although in the rarefied region
above this there are auroras and other atmospheric effects.
The total
heat capacity of the global atmosphere corresponds to that of only a 3.2
m layer of ocean.
Important points:
the science of radiation budgets is far from settled.
Much of it is guessed at while backrediation from atmosphere to
the warmer skin is an accepted myth. The Trenberth and Kiel diagram on
which the whole IPCC global warming theory is based, is entirely wrong
as No part of the 'global energy budget' can be greater than the
incident energy. The global warming discussion should have stopped
here, a long time ago. Reader, please note that this is a serious miscarriage
of science.
the importance of conduction, transport and convection
of heat is underestimated. The thermal energy is not in balance. Calculations
become overwhelming.
there is a majority consensus that greenhouse
gases trap outgoing longwave radiation and thus warm the atmosphere (the
greenhouse effect). But many scientists disagree.
but the greenhouse hypothesis where reradiated
infrared wavelengths are trapped by greenhouse gases, is wrong. It has
no basis in physics (thermodynamics, physical kinetics or radiation theory).
[2] But discussion is lively.
heat is transported and trapped by ordinary gases
of the atmosphere by conduction and convection and reradiation plays no
measurable role at Earth's temperatures. But there is some direct radiation
from the surface that reaches space unhindered.
all radiation budget diagrams show vertical radiation
but a black body radiates in all directions, also sideways. Not a critique;
just showing that it ends up warming the air.
the radiation balance cannot say anything about
surface temperature. If there is more incoming radiation, the budget is
out of balance, and the temperature goes up - that's all. This is not
a critique of the science. Previously we noticed how difficult it is to
measure Earth's temperature from its outgoing radiation. Satellites measure
some IR radiation but cannot tell where it came from: surface, troposphere
or higher up?
[1] Florence J M et al. (1950): Absorption of near-infrared
energy in certain glasses. J Res Nat Bureau of Standards, Vol 45 No
2.
[2] Gerlich, Gerhard & Ralf D Tscheuschner (2007):
Falsification
of the atmospheric CO2 greenhouse effects within the frame of physics.
In J Modern Physics Vol 23, 3 275-364. Very important reading but a bit
difficult. It completely demolishes the greenhouse effect as propagated
by popular consensus. http://arxiv.org/PS_cache/arxiv/pdf/0707/0707.1161v4.pdf.
(free) Rebuttal
(not free) disagreement
(free). An easier to read 6-page
summary (free)by Hans Schreuder, 24 June 2008. Do not miss it!
Radiation budget and
heat transfer This
diagram shows incoming and outgoing radiation, averaged by longitude, from
north to south horizontally. Note that the poles are very much smaller
than the equator. On the left vertical scale the radiation in watt per
square metre and on the right-hand scale heat transport in PegaWatt (1E15
Watt, purple). Alas only that for the northern hemisphere could be found.
The radiation budget shows that the equator enjoys an excess in radiation
(green curve), and this would result in a continuous build-up of heat were
it not transported to the poles where a radiation deficit exists. The way
this heat is transported is shown in the purple curves. At lower latitudes,
around the equator, the ocean does most of the transfer through large ocean
gyres, and because the trade winds blow towards the equator. At mid latitudes
the atmosphere takes over, eventually equalising the small polar deficit.
Note that the poles are much smaller than the diagram suggests.
There
exists considerable uncertainty about how much the tropical heat is transported
pole-ward, as this more recent graph from Trenberth & Caron differs
from Pearson's. Here the influence of ocean transport (OT) is estimated
to be considerably less than that through the atmosphere. Note that North
and South on this graph are the other way around. Note also the bogus transit
of the curves through the equator, where heat transport reverses suddenly,
rather than gradually. One should also ask why so much heat is transported
through air, whereas according to Trenberth and Kiehl, most heat is radiated
upward and out of the atmosphere.
The restless sun The
sun may not be as stable as has been thought. After all, it is a nuclear
reactor whose energy is made by a run-away process of nuclear fusion, like
a hydrogen bomb. But natural forces such as gravity and pressure keep the
process reasonably constant. What we see from Earth is the energy peeping
through the sun's gaseous 'crust'.
This graph shows a composite of various satellite observations over
three decades. It shows that the sun's irradiation varied by no more than
5 W/m2 but that a period of cooling occurred in the early 1980s, followed
by gradual warming in the 20 years since, at a rate of 0.05% per decade,
enough to explain most of the recently observed warming. Notice that the
sun's cool periods have much less variation than its warmer periods. Notice
also that the graph is vastly expanded and shifted from the zero
axis.
Various
satellites are now observing Total Solar Irradiation TSI, and once their
instruments were recalibrated, a consistent and accurate behaviour emerged,
shown here, and agreeing with observed cooling and warming periods, to
such extent that most if not all observed "warming" (after fraud was eliminated)
can be explained by variability in sunshine, thus from natural causes.
Remember that the IPCC rejected this "because humans cannot change the
sunshine". They were looking for, and blaming a human factor, e.g. CO2.
The debate should have ended here.
However,
when using a more recent proxy for solar irradiance, as measured in an
annually layered ice core from Dye-3, Greenland (Beer et al. 1994, blue
curve), the variation in solar irradiance is much larger than previously
presumed when observing a longer time period. The various cool periods
of the past co-incide well with the sun's dips in brightness. See also
Chapter7, Normal climate change.
The swinging sun Already
mentioned by famous scientist Isaac Newton, the sun does not spin around
its centre but around a centre which moves outside its diameter at times.
This swinging or shaking is caused mainly by the massive planets Jupiter,
Saturn, Uranus and Neptune, and has an effect on the material inside the
sun, spinning the way water in a glass spins when the glass is swung or
shaken. It can thus affect the sun's magnetic fields, sunspot cycles and
the way radiation exits from the sun. It can change the sun's equatorial
rotational velocity (spin) by 7%. The main cycle duration is 83-84
years, with multiples thereof. Accelerations in the sun's spin correlate
with past cool periods [4]. Indeed Scafetta [6] discovers main cycles of
60, 20 and 9.1 (moon) years in the known temperature record.
Theodor Landscheidt [4]: "change in the UV radiation
of the Sun is much greater than in the range of visible radiation.
The UV range of the [electromagnetic] spectrum lies between 100Å
and 3800Å. Wavelengths below 1500Å are called extreme
ultraviolet, EUV. The variation in radiation between extrema of the
11-year sunspot cycle reaches 35% in the EUV range, 20% at 1500Å
and 7% around 2500Å. At wavelengths above 2500Å, the
variation reaches still 2%. At the time of energetic solar eruptions,
UV radiation increases up to 16%." [Note: the Aengstrom Å is
0.0001 micrometre or 0.1 nanometre or 1E-8m] Thus shortwave UV could have
a measurable influence on gobal temperature.
With regularity, holes appear in this solar 'crust', called sunspots, and
through these sunspots energy pours out in swirls and loops, some of which
reaches Earth as fast particles. Such particles could produce condensation
trails in the thin upper atmosphere, causing high cloud and thus cooling.
Sunspots have been known for a very long time, and they have even been
counted, and records kept of these observations. So the waxing and waning
of sunspot numbers in regular 11-year cycles, has been known for a long
time. At irregular times, the sunspots become fewer and fewer, sometimes
disappearing for many years and it has been noted that this somehow coincides
with periods of cold, like the Great Potato Famine (Dalton
mimimum, 1845-1852) and before that the the Little Ice Age (Maunder minimum
1645-1715) which caused mass emigrations to the USA.
An even stronger correlation with temperature is found by observing
the duration of a sunspot cycle - the longer the cycle, the colder it is
on Earth. The relationship is -0.7ºC for every year (7-16 years) the
next cycle begins later. The bottom graph shows the anomaly of sunspots,
how they deviate from 'average' (or 'expected', or 'normal').
It seems as if the new cycle is unwilling to begin, a possible sign
of lower solar activity. Recent thinking is as follows: the Earth is subjected
to a constant flow of (slow) solar particles, which shield it from high
energy galactic cosmic radiation. With less solar wind, there will be more
cosmic radiation which is capable of creating condensation trails around
which clouds form, which in turn cools the planet.
lower solar magnetic field => fewer sunspots => less solar wind =>
more galactic cosmic rays => => more high cloud => more sunlight reflected to space => cooling
The graph shows how sunspot cycle length correlates with northern hemisphere
temperature for over one century: the shorter the cycle, the higher is
temperature. But the underlying mechanism is not fully understood. Note
that the series is still rather short to be conclusive, even though it
is much longer than that from satellite measurements. Note also the poor
correlation with CO2 in atmosphere (green) and annual emission of CO2 (0-7
Gt/y, brown). The dotted part of the green line comes from a single (questionable)
ice core (Siple Dome); the solid part from several (reliable) CO2 stations
like Mauna Loa, all located by the sea.
It
just so happens that the sun has ended a cycle (cycle 23 - purple squiggle),
but the new cycle (24) is not beginning as expected. Instead, the sun spots
are staying away. Notice how the predictions for solar cycle 24 have been
shifting, both further away and lower down. Even so, observations remain
below even the most dire prediction. We are obviously entering an area
of great uncertainty.
Could this mean a new cold spell like the Little Ice Age (1600-1800)
when sunspot numbers were low in 1645-1715 [1]? And for how long? Could
it herald the beginning of next ice age? Based on sunspot cycles, the world
will face 2 degrees cooling within a couple of years - a profound disaster.
Time is ticking . . . (Nov 2010)
Study this map for what temperature means to the prospering of society:
globaltemp4000yr.gif
. Smile about NASA's
predictions of solar cycle 24 and stay uptodate with Landscheidts Layman's
sunspot count. Right now (Feb 2011) it is tracking below that heralding
the Little Ice Age (SC5). NOAA's prediction, updated regularly: http://www.swpc.noaa.gov/SolarCycle/.
Animation of predictions vs actuals: http://wattsupwiththat.files.wordpress.com/2011/01/ssn_predict_nasa_1024.gif
Predicting
the future is most frustrating because one will always be proved wrong.
The graph here shows actual temperature (black) already deviating substantially
from IPCC projections (red) since the late 1990s. Taking account of the
sun's declining activity, new scenarios can be projected (blue), according
to past cold periods. But it could become even colder for a longer period
than shown here. Quite evidently, humans do not have a significant effect
on Earth's temperature.
Its tough to make predictions, especially
about the future. - Yogi Berra
[1] Abdusamatov, K I (2005): Long-term variations of
the integral radiation flux and possible temperature changes in the solar
core. Kinematics & Physics of Celestial Bodies. Vol 21, No 6, pp
328-332, 2005. The sunspot varies its size, surface sunspots come and go,
activity waxes and wanes, also evidenced by Mars' solar caps. Periodicity
is 11, 80 and 200 years.
[2] Friis-Christensen, Eigil, and Henrik Svensmark (1997):
What
Do We Really Know About the Sun-Climate Connection? Advances in Space
Research 20: 913-921.
[3] http://www.solarcycle24.com---http://www.solarcycle24.org/.---
http://www.landscheidt.info/---
[4] Theodor Landscheidt (2007): New Little Ice Age
Instead of Global Warming?http://www.schulphysik.de/klima/landscheidt/iceage.htm.
From solar cycles, predicts Gleissberg-type minima for 2030 and 2200 of
the severity of a Maunder-type cooling, known as the Little Ice Age that
lasted for almost a century (1600-1650).
[5] Sharp G J (): Are Uranus & Neptune responsible
for Solar Grand Minima and Solar Cycle Modulation? - http://arxiv.org/ftp/arxiv/papers/1005/1005.5303.pdf
- examines influence of planets on solar motion and temperature. (diffcult
subject)
[6] Nicola Scafetta (2010): Empirical evidence for
a celestial origin of the climate oscillations and its implications
- http://arxiv.org/PS_cache/arxiv/pdf/1005/1005.4639v1.pdf
- analyses the power spectrum of known temperatures and finds important
cycles. (difficult)
Cosmic radiation Recently
more attention is paid to cosmic radiation originating from outside our
solar system. The graph here shows a strong correlation between temperature
(by its proxy oxygen-18) from calcite (CaCO3) in unpolluted cave stalagmites
(dripstones), and carbon-14 from tree rings of some very old trees. The
unstable isotope carbon-14 is produced in the upper atmosphere by cosmic
radiation, and the quantity produced, varies slowly with time. It decays
slowly and very predictively, such that after 5000 years, still about half
of it can be found. Thus any variation from the expected value must have
been caused by cosmic radiation. How it influences temperature, remains
a mystery for now.
Note that 14-C concentrations would be about 50% (on right) to 25% (on
left), compared to today's values, and that 20 variation is only very
little. We're talking about small variations having large effects.
Cosmic
radiation in the form of neutrons reaching Earth, interferes with the atmosphere
in such a way that more cloud is formed when neutron radiation is less.
Why, is not understood. It appears that the solar wind influences the Earth's
magnetic field, while also shielding Earth from cosmic radiation. A change
in solar wind could explain the above two correlations.
An explanation goes like this: when the sun is active, it has more sunspots.
It also sends out more particles (the solar wind). These form a
protective shield around the sun and its planet, that is very large but
thin. Within this shield, particles from the sun interact with those arriving
from outside the solar system
(cosmic radiation), scattering or
diminishing them. When the sun becomes less active, more cosmic radiation
reaches Earth where it forms condensation nuclei, which in turn
form clouds. Thus Earth cools. This effect is larger than the actual changes
in solar radiation, the solar constant.
Please note that cosmic radiation is far more energetic (GeV, giga-electron-volt)
than solar particle radiation (MeV, mega-electron-volt).
The chilling stars Quite
recently [1] scientists have begun to see a link between cosmic particles
from distant stars as a major influence on Earth's climate. The Sun rotates
around its galactic centre (Milky Way) in around 226 million years (a solar
'year'). Because it travels faster than the arms of the Milky Way, it passes
through one arm every 140 million years. The arms are called Perseus,
Norma,
Scutum-Centaurus
and Sagittarius-Car). When our solar system is in such an arm, it
experiences a higher density of cosmic radiation than in the gaps in-between.
The cosmic ray flux in these spiral arms is ten times more intensive than
that of the sun, penetrating its protective solar wind and causing major
temperature changes on Earth. As the graph shows, there is a strong correlation.
Thus the distant stars combined with the sun's activity, may well have
a more decisive influence on Earth's climate, than mankind. Note that the
cosmic ray flux (flow) is plotted upside down, thus more cosmic radiation
introduces cold and less radiation warmth.
It has recently been discovered that our Milky Way has two main arms,
Perseus
and Scutum-Centaurus as shown on this artist's impression of our
Milky Way, and which is also borne out by the above graph. Our galaxy has
a bar-shaped centre, dense with stars, from which several arms spiral out.
The artist's concept also includes a new spiral arm, called the Far-3
kiloparsec arm, discovered via a radio-telescope survey of gas in the
Milky Way. This arm is shorter than the two major arms and lies along the
bar of the galaxy, thus not in the Sun's path. Our sun lies near a small,
partial arm called the Orion Arm, or Orion Spur, located
between the Sagittarius and Perseus arms.
Note that much uncertainty remains.
[1] www.sciencebits.com/CosmicRaysClimateCosmic
rays and climate. By Nir J Shaviv (2006), for more information.
[2] search the Internet for Svensmark.
Other
influences on radiation Solar
radiation is not only affected by the gases in the atmosphere, but also
by volcanic activity and human activities. Large volcanic eruptions
have always had an effect on climate, mainly in the first year following,
and to a gradually lesser extent in the four years after that. The graph
shows how two recent volcanoes absorbed up to 20% of the sunlight, for
several years. The VEI number is a measure of the size of the eruption.
Undersea volcanoes are the invisible part of volcanic heat transfer,
and their effect is unknown. At the mid-ocean ridges, the sea floor is
spreading, which is accompanied with the release of heat. What is known,
is that the world is going through a period of more active volcanism, both
on land and in the sea.
ash: as siliceous molten rock 'explodes' due to the high pressure
of gas (methane and CO2) dissolved inside, it pulverises into dust and
specks of glass (SiO2), carried high into the atmosphere, lifted by the
heat in the cloud. The dust blankets the earth, reflecting incoming radiation
back to space, causing widespread cooling.
gases: the main gas expelled by volcanic explosions is CO2, which
is thought to contribute to global warming. Volcanoes release over 130Mt
of CO2 annually. Compare this with 7 Gt/yC= 25,000 Mt CO2 from fossil energy.
sulfur: volcanoes also expel sulfurdioxide (SO2) which becomes sulfuric
acid at an altitude of around 20km in the stratosphere. Sulfuric acid promotes
the formation of clouds which reflect solar light away, causing cooling
for many years after an eruption.
con trails: aircraft make condensation trails (contrails) at high
altitude where their exhaust water vapours condense into ice clouds, causing
climatic cooling. They also introduce CO2 at high altitude. Because fewer
aircraft fly at night, the night air gradually clears, allowing for heat
to be radiated out to space. During the day their contrails produce a high
altitude fog which lowers the day-time temperature. In 1960: 1.09E11 passenger-kilometres;
in 2003: 29.92E11 passenger-kilometres, an increase of almost 30-fold in
40 years.
black soot: industrial burning of fossil fuels produces soot, and
ocean ships are a significant source of it. But also the burning of crop
residue and the clearing of forests, cause significant quantities. When
black soot lands on white ice, it can cause a dramatic change in temperature,
resulting in early melting.
tar-sealed roads: the grey-black tar-seal (asphalt) of roads becomes
much hotter than the area around, causing local changes to climate.
urbanisation: cities consist of surfaces which do not evaporate
moisture, such as plants do. During the day they become much warmer than
a natural environment, and during the night much colder. Their total effect
is warming, also known as the Urban Heat Island effect (UHI).
man-made CO2: anthropogenic (man-made) carbondioxide from the burning
of fossil fuels is widely blamed for destabilising Earth's temperature
such that 'catastrophic' run-away warming is feared. We've seen above that
this is not possible, and we'll return to this issue time and again. The
principle behind the fear is: 1) CO2 absorbs heat 2) we see global
warming 3) we can't explain it other than blaming it on CO2. 4) when
fed into our computer models, they predict what we expect. A separate chapter
is dedicated to the fear of catastrophic global
warming.
methane CH4: Its present density in the atmosphere is 1.74 ppmv
or 1.12 grams per cubic meter of air. This amount is 219 times smaller
than the present density of atmospheric CO2. The heat forcing by the Methane
in its present density in the atmosphere is hardly 0.000535 W/m2, which
it is equivalent to 0.00013 calories-thermal. Forget about methane.
man-made heat: by burning ever more fossil fuels that in the end
produce heat, could it be possible that we are warming our atmosphere?
Human energy production is about 1E14 Watt, and the Earth's surface area
is about 1E16 square metres, amounting to 0.01 W/m2, which is negligible
compared to incoming radiation of about 350 W/m2, but in the order of the
sun's variation of 0.05 W/m2.
 Our
nearest planets are all like Earth, 'rocky' rather than 'gassy'. None produce
enough heat by themselves to make a difference (it is thought), such that
their temperatures are determined by the heat from the 6000ºC (5800ºK)
sun and how much they re-radiate back into space. The graph shows the positions
of these planets relative to the sun, measured in Astronomical Units (AU),
equivalent to the distance between sun and Earth (150 million km or 8 light-minutes).
The vertical scale is logarithmic and represents solar irradiation, the
solar constant in Watt per square metre, but also the planet's temperature
in degrees Kelvin (1K=-273ºC). For details see the table below.Note
that the degree sign º is omitted for Kelvin.
Our
nearest planets are all like Earth, 'rocky' rather than 'gassy'. None produce
enough heat by themselves to make a difference (it is thought), such that
their temperatures are determined by the heat from the 6000ºC (5800ºK)
sun and how much they re-radiate back into space. The graph shows the positions
of these planets relative to the sun, measured in Astronomical Units (AU),
equivalent to the distance between sun and Earth (150 million km or 8 light-minutes).
The vertical scale is logarithmic and represents solar irradiation, the
solar constant in Watt per square metre, but also the planet's temperature
in degrees Kelvin (1K=-273ºC). For details see the table below.Note
that the degree sign º is omitted for Kelvin.
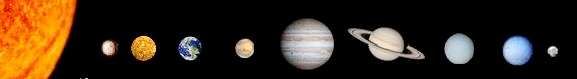
 The
diagram shows the temperature gradients of the atmosphere, ocean and crust.
Where a gradient (gradual change) exists, there must also be a transport
of heat along that gradient from warm to cold (right to left in the diagram).
This heat transport also depends on the density of the medium. The crust
is 3 times denser than water, which is 800 times denser than air, but it
transfers only about 0.06W/m2, which is negligible in the planet's heat
budget. The oceans (blue curve) have a steep gradient and good mixing in
the first 100m, but from 800m down, they are all equally cold to a minimum
of 4ºC, corresponding with water's highest density. The only way for
this cold water to surface, is to be replaced by equally cold water from
the thermo-haline circulation. So for practical purposes, only the
first 100-200m matter in climate change (perhaps
The
diagram shows the temperature gradients of the atmosphere, ocean and crust.
Where a gradient (gradual change) exists, there must also be a transport
of heat along that gradient from warm to cold (right to left in the diagram).
This heat transport also depends on the density of the medium. The crust
is 3 times denser than water, which is 800 times denser than air, but it
transfers only about 0.06W/m2, which is negligible in the planet's heat
budget. The oceans (blue curve) have a steep gradient and good mixing in
the first 100m, but from 800m down, they are all equally cold to a minimum
of 4ºC, corresponding with water's highest density. The only way for
this cold water to surface, is to be replaced by equally cold water from
the thermo-haline circulation. So for practical purposes, only the
first 100-200m matter in climate change (perhaps
 When
a thermometer cannot be placed directly on a planet, scientists determine
its temperature from the heat it radiates out. For instance, this graph
shows the incoming light (yellow) and outgoing heat radiation (green) of
Earth. Because the atmosphere absorbs some 'colours', both spectra look
rather frayed. Vertical is the light intensity and horizontal the wave
length (= 'colour') in microns. Visible light runs from 0.4 to 0.7 micron,
a narrow band, whereas infrared runs from 0.8 to 50 micron, a very wide
band. The red envelope belongs to a body of 6000ºK and the green envelope
clumsily fits around the outgoing heat radiation, but with enough uncertainty
that we can't say for sure what precisely the temperature is seen from
outside the Earth: somewhere between 260 and 300K (-13 to +27ºC).
Keep this in mind when interpreting the table above.
When
a thermometer cannot be placed directly on a planet, scientists determine
its temperature from the heat it radiates out. For instance, this graph
shows the incoming light (yellow) and outgoing heat radiation (green) of
Earth. Because the atmosphere absorbs some 'colours', both spectra look
rather frayed. Vertical is the light intensity and horizontal the wave
length (= 'colour') in microns. Visible light runs from 0.4 to 0.7 micron,
a narrow band, whereas infrared runs from 0.8 to 50 micron, a very wide
band. The red envelope belongs to a body of 6000ºK and the green envelope
clumsily fits around the outgoing heat radiation, but with enough uncertainty
that we can't say for sure what precisely the temperature is seen from
outside the Earth: somewhere between 260 and 300K (-13 to +27ºC).
Keep this in mind when interpreting the table above. 
 This
graph shows how average albedo on Earth changes with latitude (red curve).
In the background a map of the earth showing normal (light green, plains/grass)
and extra dry (yellow, deserts) or wet (dark green,forests) areas The sea
was left white but should have been dark-blue. Albedo
is low (dark) at the equator, and high (light) towards the poles. There
exists a marked difference between northern and southern hemispheres mainly
because there is more ocean down south. The desert bands (20-35º)
do not make much impact because at their latitudes, still a lot of ocean
is found. Between -60 and -70 degrees latitude, albedo increases steeply
because Antarctica is a white continent surrounded by dark oceans. The
south pole is also whiter than the north pole because the north pole is
an ocean surrounded by continents, and in summer with less sea ice.
This
graph shows how average albedo on Earth changes with latitude (red curve).
In the background a map of the earth showing normal (light green, plains/grass)
and extra dry (yellow, deserts) or wet (dark green,forests) areas The sea
was left white but should have been dark-blue. Albedo
is low (dark) at the equator, and high (light) towards the poles. There
exists a marked difference between northern and southern hemispheres mainly
because there is more ocean down south. The desert bands (20-35º)
do not make much impact because at their latitudes, still a lot of ocean
is found. Between -60 and -70 degrees latitude, albedo increases steeply
because Antarctica is a white continent surrounded by dark oceans. The
south pole is also whiter than the north pole because the north pole is
an ocean surrounded by continents, and in summer with less sea ice. The
albedo of Earth has been reconstructed from overlapping satellite images
(blue line, Pallé E et al. 2004), here graphed upside down because
an increase in albedo makes the planet more reflective, thus cooler. Note
how albedo diminished (less cloud cover) a massive -10% in as little as
15 years, corresponding to a radiative 'forcing' of +10W/m2 or 0.6W/m2
per year. By comparison, the IPCC worries about a warming effect of 2.4
W/m2 in a century. In red, the sea temperature from Endersbee. Note the
strong correlation between albedo and temperature. Note also that most
of the sun's radiation ends up in the sea from where it escapes more slowly
than from the land.
The
albedo of Earth has been reconstructed from overlapping satellite images
(blue line, Pallé E et al. 2004), here graphed upside down because
an increase in albedo makes the planet more reflective, thus cooler. Note
how albedo diminished (less cloud cover) a massive -10% in as little as
15 years, corresponding to a radiative 'forcing' of +10W/m2 or 0.6W/m2
per year. By comparison, the IPCC worries about a warming effect of 2.4
W/m2 in a century. In red, the sea temperature from Endersbee. Note the
strong correlation between albedo and temperature. Note also that most
of the sun's radiation ends up in the sea from where it escapes more slowly
than from the land.  In
order to understand Milankovic cycles, it is important to first understand
how summer and winter arise. In the diagram, Earth is shown rotating around
the sun in a counter-clockwise direction when looking down from the north.
The planet itself rotates around its axis in the same direction, but at
a slight angle of 23.5º. Northern hemisphere summer occurs when the
northern half tilts towards the sun in June, and likewise for the southern
hemisphere in December. In the northern summer, Earth is also 1.7% closer
to the sun, thus the northern summer gets 3.4% more sunlight (= 3.5% more
heat) or 1.7x3= 5 degrees C (see above), and the difference between northern
and southern hemispheres amounts to 7 % in heat or 10 degrees C. These
differences are quite large and have an influence on the climate system.
In
order to understand Milankovic cycles, it is important to first understand
how summer and winter arise. In the diagram, Earth is shown rotating around
the sun in a counter-clockwise direction when looking down from the north.
The planet itself rotates around its axis in the same direction, but at
a slight angle of 23.5º. Northern hemisphere summer occurs when the
northern half tilts towards the sun in June, and likewise for the southern
hemisphere in December. In the northern summer, Earth is also 1.7% closer
to the sun, thus the northern summer gets 3.4% more sunlight (= 3.5% more
heat) or 1.7x3= 5 degrees C (see above), and the difference between northern
and southern hemispheres amounts to 7 % in heat or 10 degrees C. These
differences are quite large and have an influence on the climate system.
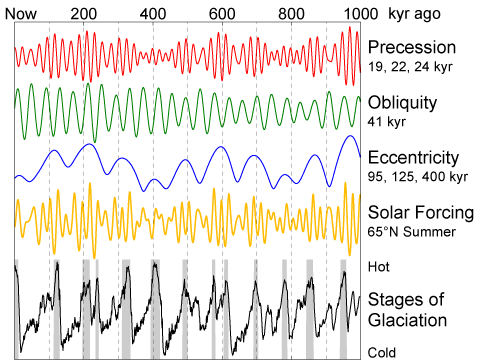 Milutin
Milankovic (28 May 1879 12 December 1958), was a Serbian civil engineer
and geophysicist, best known for his theory of ice ages, relating variations
of the Earth's orbit and long-term climate change, now known as Milankovitch
cycles. The diagram (from Wikipedia) shows the nature of the cycles and
how these influence solar radiation (solar forcing). Milankovic thought
that the ice ages could be explained this way. However, the planet has
known ice ages only during the Pleistocene, back to 1.6 million years ago
whereas the Milankovic cycles must be very much older. Note also that there
is no hard correspondence between the oscillations shown and the recorded
ice ages.
Milutin
Milankovic (28 May 1879 12 December 1958), was a Serbian civil engineer
and geophysicist, best known for his theory of ice ages, relating variations
of the Earth's orbit and long-term climate change, now known as Milankovitch
cycles. The diagram (from Wikipedia) shows the nature of the cycles and
how these influence solar radiation (solar forcing). Milankovic thought
that the ice ages could be explained this way. However, the planet has
known ice ages only during the Pleistocene, back to 1.6 million years ago
whereas the Milankovic cycles must be very much older. Note also that there
is no hard correspondence between the oscillations shown and the recorded
ice ages.  Over
thousands of millions of years (eons), the sun has become brighter, and
during the 4.5 eons that Earth had a crust, its luminosity increased by
about 25% (red curve). Plotting Earth's temperature back in time (blue
line), Earth should have been a snow ball earlier than 2 eons ago, but
ancient rocks show neither such low temperatures, nor excessive CO2 to
balance the heat. To make matters worse, at that time, life had not invaded
the land, and it looked like a large bright desert, reflecting much of
the solar radiation back to space. However, back then, the oceans were
also larger, which is where most solar radiation was absorbed. Thus the
surface temperature shown in the diagram (blue line) must be adjusted upward,
above 273ºK (0ºC, the freezing point of water), following the
early accretion of Earth's crust(brown shape) consisting of high albedo
rock and desert.
Over
thousands of millions of years (eons), the sun has become brighter, and
during the 4.5 eons that Earth had a crust, its luminosity increased by
about 25% (red curve). Plotting Earth's temperature back in time (blue
line), Earth should have been a snow ball earlier than 2 eons ago, but
ancient rocks show neither such low temperatures, nor excessive CO2 to
balance the heat. To make matters worse, at that time, life had not invaded
the land, and it looked like a large bright desert, reflecting much of
the solar radiation back to space. However, back then, the oceans were
also larger, which is where most solar radiation was absorbed. Thus the
surface temperature shown in the diagram (blue line) must be adjusted upward,
above 273ºK (0ºC, the freezing point of water), following the
early accretion of Earth's crust(brown shape) consisting of high albedo
rock and desert.  This
diagram brings three factors together: sun spots,
carbon-14
ratio and average temperature. Note
that the scale of C-14 is upside down. Carbon-14 is produced by normal
nitrogen-14 absorbing a low-energy ('thermal') neutron and releasing one
hydrogen ion in the upper atmosphere:
This
diagram brings three factors together: sun spots,
carbon-14
ratio and average temperature. Note
that the scale of C-14 is upside down. Carbon-14 is produced by normal
nitrogen-14 absorbing a low-energy ('thermal') neutron and releasing one
hydrogen ion in the upper atmosphere:
 In
order to deepen our understanding of how Earth's actual atmosphere works,
we'll study a number of imaginary atmospheres, but first the glasshouse
experiment (Robert W Wood 1909, Businger [1]). It is a simple experiment
with three well insulated identical boxes A, B, C. A is open. B is covered
in glass which lets light through but which blocks infrared light. Most
glasses do this. C is covered with a special window made from salt (NaCl)
which is known to be transparent to both light and infrared. Many plastics
do this too. After exposure to sunlight, container A remains a little warmer
than outside but the covered containers warm up considerably, reaching
identical high temperatures of 55ºC with "hardly a degree difference".
If the greenhouse effect were caused by blocking infrared radiation, container
B would have become much warmer than C. In fact C becomes a little warmer
because glass still blocks a little of the incoming solar infrared radiation.
When the experiment is left to cool, the cooling rate is determined by
the thickness of the glass. Conclusion: at Earth's temperatures and air
densities, outgoing infrared radiation is negligible compared to conduction
and convection. The greenhouse effect is not caused by infrared-blocking
gases. Later we'll come across other reasons why this is so. The experiment
has also been replicated by others [2] and with balloons [3] and very thoroughly
In
order to deepen our understanding of how Earth's actual atmosphere works,
we'll study a number of imaginary atmospheres, but first the glasshouse
experiment (Robert W Wood 1909, Businger [1]). It is a simple experiment
with three well insulated identical boxes A, B, C. A is open. B is covered
in glass which lets light through but which blocks infrared light. Most
glasses do this. C is covered with a special window made from salt (NaCl)
which is known to be transparent to both light and infrared. Many plastics
do this too. After exposure to sunlight, container A remains a little warmer
than outside but the covered containers warm up considerably, reaching
identical high temperatures of 55ºC with "hardly a degree difference".
If the greenhouse effect were caused by blocking infrared radiation, container
B would have become much warmer than C. In fact C becomes a little warmer
because glass still blocks a little of the incoming solar infrared radiation.
When the experiment is left to cool, the cooling rate is determined by
the thickness of the glass. Conclusion: at Earth's temperatures and air
densities, outgoing infrared radiation is negligible compared to conduction
and convection. The greenhouse effect is not caused by infrared-blocking
gases. Later we'll come across other reasons why this is so. The experiment
has also been replicated by others [2] and with balloons [3] and very thoroughly
 Air
is a paradoxical substance. When you are standing in a freezing gale, the
wind is trying to freeze you while at the same time the air in your clothing
is keeping you warm. Why? Air (nitrogen and oxygen) is an excellent insulator
for heat when it is not allowed to move, such as in woollen clothing. But
once it moves, it becomes a good conductor of heat. Why?
Air
is a paradoxical substance. When you are standing in a freezing gale, the
wind is trying to freeze you while at the same time the air in your clothing
is keeping you warm. Why? Air (nitrogen and oxygen) is an excellent insulator
for heat when it is not allowed to move, such as in woollen clothing. But
once it moves, it becomes a good conductor of heat. Why?
 The two diagrams
show a CO2 atmosphere at Earth's conditions (low concentration with nitrogen)
and the situation on Venus. CO2 has only little effect on the incoming
radiation and some effect on the outgoing radiation. At 300ppm it is already
almost fully opaque ('black') for the wavelengths it blocks, within one
metre! Within a few metres it has stopped all the infrared it could possibly
stop, and converted this energy to heat, radiating again over a wide spectrum
in all directions. In other words, CO2 mainly contributes to convection.
In the upper atmosphere an increase in CO2 concentration (say, from 400
to 800 ppm at the surface) could have an effect, but there's little it
can do here because all the radiation it could absorb has been absorbed
and retransmitted at other wavelenghts. Besides, the cooler air here cannot
warm the warmer air below it. The situation on Venus which is surrounded
by almost pure CO2, is entirely different for other reasons.
The two diagrams
show a CO2 atmosphere at Earth's conditions (low concentration with nitrogen)
and the situation on Venus. CO2 has only little effect on the incoming
radiation and some effect on the outgoing radiation. At 300ppm it is already
almost fully opaque ('black') for the wavelengths it blocks, within one
metre! Within a few metres it has stopped all the infrared it could possibly
stop, and converted this energy to heat, radiating again over a wide spectrum
in all directions. In other words, CO2 mainly contributes to convection.
In the upper atmosphere an increase in CO2 concentration (say, from 400
to 800 ppm at the surface) could have an effect, but there's little it
can do here because all the radiation it could absorb has been absorbed
and retransmitted at other wavelenghts. Besides, the cooler air here cannot
warm the warmer air below it. The situation on Venus which is surrounded
by almost pure CO2, is entirely different for other reasons.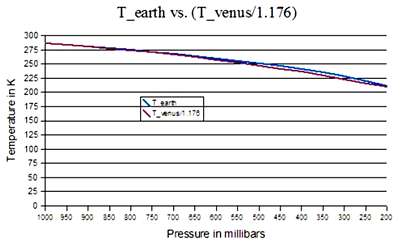 Harry
Dale Huffman [1,2] discovered that at Earthly tropospheric pressure (sea
level 1000mBar to 200mBar at the top of the troposphere), the temperature
gradients of Earth and Venus are identical as shown by this graph (Earth
blue, Venus purple). Horizontally the tropospheric pressure from the surface
up, and vertically the temperature, corrected by 1.176 because Venus is
closer to the sun [1]. So an atmosphere with almost 100% CO2 behaves identically
to one with almost 0%!!! Likewise, an atmosphere without any water vapour
(Venus) behaves like one half saturated in it (Earth).
Harry
Dale Huffman [1,2] discovered that at Earthly tropospheric pressure (sea
level 1000mBar to 200mBar at the top of the troposphere), the temperature
gradients of Earth and Venus are identical as shown by this graph (Earth
blue, Venus purple). Horizontally the tropospheric pressure from the surface
up, and vertically the temperature, corrected by 1.176 because Venus is
closer to the sun [1]. So an atmosphere with almost 100% CO2 behaves identically
to one with almost 0%!!! Likewise, an atmosphere without any water vapour
(Venus) behaves like one half saturated in it (Earth).
 Adding
water to the nitrogen atmosphere discussed above, changes the picture quite
radically as two very reflective substances are added: ice caps and clouds.
Of these the ice caps store a very large amount of latent heat (coolth),
changing in size only slowly. By comparison, clouds are ephemeral
(short-lasting). In addition, convection with water vapour is much more
effective because water vapour has high latent heat and condenses
at altitude, raining down rapidly, and thereby conveying heat upward and
cold downward. Even though air contains only 2-3% water, its ability to
convey heat and cold increases considerably. See also our next chapter
on
Adding
water to the nitrogen atmosphere discussed above, changes the picture quite
radically as two very reflective substances are added: ice caps and clouds.
Of these the ice caps store a very large amount of latent heat (coolth),
changing in size only slowly. By comparison, clouds are ephemeral
(short-lasting). In addition, convection with water vapour is much more
effective because water vapour has high latent heat and condenses
at altitude, raining down rapidly, and thereby conveying heat upward and
cold downward. Even though air contains only 2-3% water, its ability to
convey heat and cold increases considerably. See also our next chapter
on 
 Suppose
the world is mainly barren, with a patch of black daisies and a patch of
white daisies of the same species. Because black daisies absorb more heat,
they can live in the colder parts of the planet, while the white daisies
live in the warmer parts, reflecting more light, and making these parts
more inhabitable. The word will soon be covered in black and white, and
grey in the area where both survive, as shown in the left image.
Suppose
the world is mainly barren, with a patch of black daisies and a patch of
white daisies of the same species. Because black daisies absorb more heat,
they can live in the colder parts of the planet, while the white daisies
live in the warmer parts, reflecting more light, and making these parts
more inhabitable. The word will soon be covered in black and white, and
grey in the area where both survive, as shown in the left image.
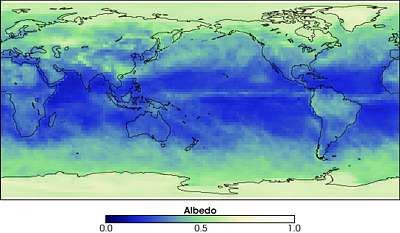 The
problem with Earth is that its albedo is rather the opposite of Daisyworld,
as shown in this image from the CERES satellite. Thus daisyworld cannot
counteract the ice age drivers:
The
problem with Earth is that its albedo is rather the opposite of Daisyworld,
as shown in this image from the CERES satellite. Thus daisyworld cannot
counteract the ice age drivers:
 James
Lovelock, in trying to find the circulation of sulfur from sea to land,
discovered and measured the molecule dimethylsulfide DMS (CH3-S-CH3), produced
by plankton [1,2]. Although much bigger than the water molecule (H-O-H),
it has a similarly polarised form, which attracts water molecules. Because
water molecules are already attracted to one another, dimethylsulfide acts
as a condensation nucleus, assisting water to change into cloud.
James
Lovelock, in trying to find the circulation of sulfur from sea to land,
discovered and measured the molecule dimethylsulfide DMS (CH3-S-CH3), produced
by plankton [1,2]. Although much bigger than the water molecule (H-O-H),
it has a similarly polarised form, which attracts water molecules. Because
water molecules are already attracted to one another, dimethylsulfide acts
as a condensation nucleus, assisting water to change into cloud.
 The
effects from land use on climate, have not had extensive coverage, and
they do not feature in IPCC climate change models either. However, the
effect of changing a forest cover into arable lands, and the building of
cities, houses and roads, has had a major effect on climate and is still
continuing as world population grows. Once upon a time, the lowlands
near ocean coasts were lush forests and swamps. Moisture from the oceans
(all rain comes from the sea) would rise and cool above the lowlands, and
the rain would be sponged up by forests and deep soils. The forests in
turn would re-evaporate moisture only to fall as rain further inland, and
so on. In the end, even the central deserts of the continents would get
some rain.
The
effects from land use on climate, have not had extensive coverage, and
they do not feature in IPCC climate change models either. However, the
effect of changing a forest cover into arable lands, and the building of
cities, houses and roads, has had a major effect on climate and is still
continuing as world population grows. Once upon a time, the lowlands
near ocean coasts were lush forests and swamps. Moisture from the oceans
(all rain comes from the sea) would rise and cool above the lowlands, and
the rain would be sponged up by forests and deep soils. The forests in
turn would re-evaporate moisture only to fall as rain further inland, and
so on. In the end, even the central deserts of the continents would get
some rain.
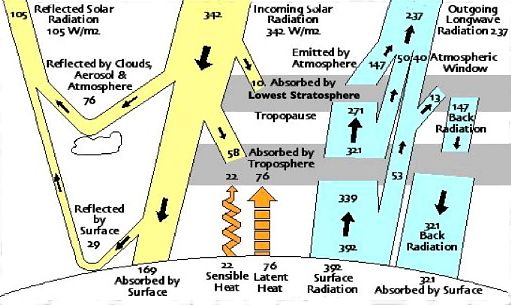 The
diagram shown here is perhaps the most detailed available today (Kiel &
Trenberth). All quantities in W/m2. Average incoming radiation is 342 of
which 76+29 (31%) is immediately reflected back and 10+58 (20%) absorbed
by the atmosphere, leaving 29 (8%) reflected by the surface and 169 (49%)
absorbed. Heat convection by air and water vapour 22+76 (29%) heats the
lower atmosphere (troposphere). The surface radiates 392 out but receives
321 by back radiation 392-321 (21%). Of this 71, 53 (15%) penetrates the
troposphere, etc. etc. Finally 237 (69%) leaves the planet as infrared
radiation. Note that the 'atmospheric window' (surface to space) for infrared
is a mere 40 (12%) and that highly variable clouds account for 76 (22%).
This diagram also appeared in the IPCC AR4 report, and the name Trenberth
is exposed through climategate. Take care, for the nonsense can be clearly
seen as follows:.
The
diagram shown here is perhaps the most detailed available today (Kiel &
Trenberth). All quantities in W/m2. Average incoming radiation is 342 of
which 76+29 (31%) is immediately reflected back and 10+58 (20%) absorbed
by the atmosphere, leaving 29 (8%) reflected by the surface and 169 (49%)
absorbed. Heat convection by air and water vapour 22+76 (29%) heats the
lower atmosphere (troposphere). The surface radiates 392 out but receives
321 by back radiation 392-321 (21%). Of this 71, 53 (15%) penetrates the
troposphere, etc. etc. Finally 237 (69%) leaves the planet as infrared
radiation. Note that the 'atmospheric window' (surface to space) for infrared
is a mere 40 (12%) and that highly variable clouds account for 76 (22%).
This diagram also appeared in the IPCC AR4 report, and the name Trenberth
is exposed through climategate. Take care, for the nonsense can be clearly
seen as follows:. A
diagram from Wallace & Hobbs in the late 70s. Note how these figures
disagree with those from other authors. The science of the radiation budget
is far from settled, but there is another problem - these figures are not
constant, but vary enormously from place to place, year to year, season
to season, day to night and so on. The fear of manmade global warming comes
from the notion that, all things remaining equal (which is not likely),
increasing levels of CO2 will alter the energy budget such that more heat
stays in the atmospheric 'blanket'. For that to happen, we need to look
at the radiation absorption of CO2 and other greenhouse gases.
A
diagram from Wallace & Hobbs in the late 70s. Note how these figures
disagree with those from other authors. The science of the radiation budget
is far from settled, but there is another problem - these figures are not
constant, but vary enormously from place to place, year to year, season
to season, day to night and so on. The fear of manmade global warming comes
from the notion that, all things remaining equal (which is not likely),
increasing levels of CO2 will alter the energy budget such that more heat
stays in the atmospheric 'blanket'. For that to happen, we need to look
at the radiation absorption of CO2 and other greenhouse gases.
 This
diagram shows incoming and outgoing radiation, averaged by longitude, from
north to south horizontally. Note that the poles are very much smaller
than the equator. On the left vertical scale the radiation in watt per
square metre and on the right-hand scale heat transport in PegaWatt (1E15
Watt, purple). Alas only that for the northern hemisphere could be found.
This
diagram shows incoming and outgoing radiation, averaged by longitude, from
north to south horizontally. Note that the poles are very much smaller
than the equator. On the left vertical scale the radiation in watt per
square metre and on the right-hand scale heat transport in PegaWatt (1E15
Watt, purple). Alas only that for the northern hemisphere could be found.
 There
exists considerable uncertainty about how much the tropical heat is transported
pole-ward, as this more recent graph from Trenberth & Caron differs
from Pearson's. Here the influence of ocean transport (OT) is estimated
to be considerably less than that through the atmosphere. Note that North
and South on this graph are the other way around. Note also the bogus transit
of the curves through the equator, where heat transport reverses suddenly,
rather than gradually. One should also ask why so much heat is transported
through air, whereas according to Trenberth and Kiehl, most heat is radiated
upward and out of the atmosphere.
There
exists considerable uncertainty about how much the tropical heat is transported
pole-ward, as this more recent graph from Trenberth & Caron differs
from Pearson's. Here the influence of ocean transport (OT) is estimated
to be considerably less than that through the atmosphere. Note that North
and South on this graph are the other way around. Note also the bogus transit
of the curves through the equator, where heat transport reverses suddenly,
rather than gradually. One should also ask why so much heat is transported
through air, whereas according to Trenberth and Kiehl, most heat is radiated
upward and out of the atmosphere.  The
sun may not be as stable as has been thought. After all, it is a nuclear
reactor whose energy is made by a run-away process of nuclear fusion, like
a hydrogen bomb. But natural forces such as gravity and pressure keep the
process reasonably constant. What we see from Earth is the energy peeping
through the sun's gaseous 'crust'.
The
sun may not be as stable as has been thought. After all, it is a nuclear
reactor whose energy is made by a run-away process of nuclear fusion, like
a hydrogen bomb. But natural forces such as gravity and pressure keep the
process reasonably constant. What we see from Earth is the energy peeping
through the sun's gaseous 'crust'.
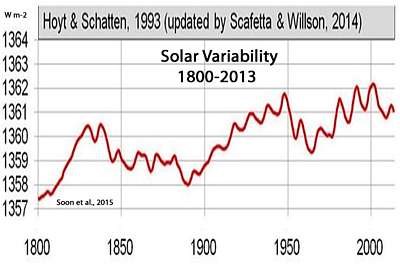 Various
satellites are now observing Total Solar Irradiation TSI, and once their
instruments were recalibrated, a consistent and accurate behaviour emerged,
shown here, and agreeing with observed cooling and warming periods, to
such extent that most if not all observed "warming" (after fraud was eliminated)
can be explained by variability in sunshine, thus from natural causes.
Remember that the IPCC rejected this "because humans cannot change the
sunshine". They were looking for, and blaming a human factor, e.g. CO2.
The debate should have ended here.
Various
satellites are now observing Total Solar Irradiation TSI, and once their
instruments were recalibrated, a consistent and accurate behaviour emerged,
shown here, and agreeing with observed cooling and warming periods, to
such extent that most if not all observed "warming" (after fraud was eliminated)
can be explained by variability in sunshine, thus from natural causes.
Remember that the IPCC rejected this "because humans cannot change the
sunshine". They were looking for, and blaming a human factor, e.g. CO2.
The debate should have ended here.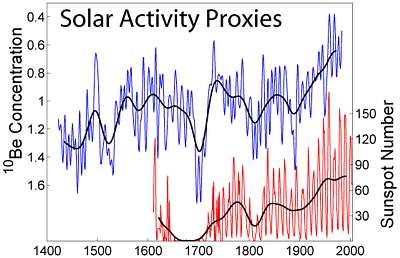 However,
when using a more recent proxy for solar irradiance, as measured in an
annually layered ice core from Dye-3, Greenland (Beer et al. 1994, blue
curve), the variation in solar irradiance is much larger than previously
presumed when observing a longer time period. The various cool periods
of the past co-incide well with the sun's dips in brightness. See also
However,
when using a more recent proxy for solar irradiance, as measured in an
annually layered ice core from Dye-3, Greenland (Beer et al. 1994, blue
curve), the variation in solar irradiance is much larger than previously
presumed when observing a longer time period. The various cool periods
of the past co-incide well with the sun's dips in brightness. See also
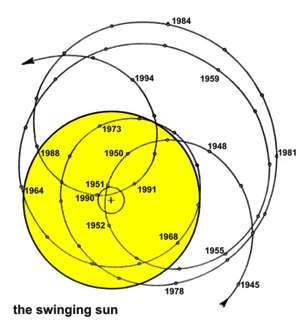 Already
mentioned by famous scientist Isaac Newton, the sun does not spin around
its centre but around a centre which moves outside its diameter at times.
This swinging or shaking is caused mainly by the massive planets Jupiter,
Saturn, Uranus and Neptune, and has an effect on the material inside the
sun, spinning the way water in a glass spins when the glass is swung or
shaken. It can thus affect the sun's magnetic fields, sunspot cycles and
the way radiation exits from the sun. It can change the sun's equatorial
rotational velocity (spin) by 7%. The main cycle duration is 83-84
years, with multiples thereof. Accelerations in the sun's spin correlate
with past cool periods [4]. Indeed Scafetta [6] discovers main cycles of
60, 20 and 9.1 (moon) years in the known temperature record.
Already
mentioned by famous scientist Isaac Newton, the sun does not spin around
its centre but around a centre which moves outside its diameter at times.
This swinging or shaking is caused mainly by the massive planets Jupiter,
Saturn, Uranus and Neptune, and has an effect on the material inside the
sun, spinning the way water in a glass spins when the glass is swung or
shaken. It can thus affect the sun's magnetic fields, sunspot cycles and
the way radiation exits from the sun. It can change the sun's equatorial
rotational velocity (spin) by 7%. The main cycle duration is 83-84
years, with multiples thereof. Accelerations in the sun's spin correlate
with past cool periods [4]. Indeed Scafetta [6] discovers main cycles of
60, 20 and 9.1 (moon) years in the known temperature record. 
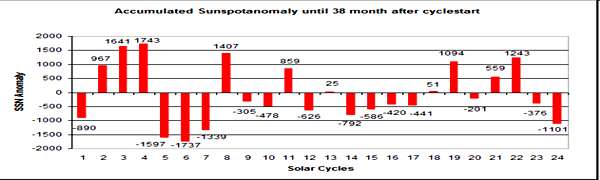
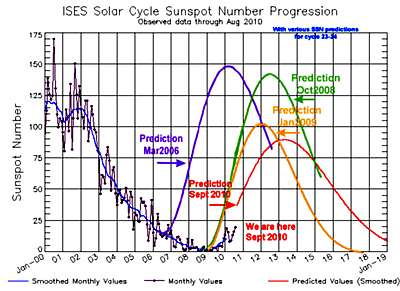 It
just so happens that the sun has ended a cycle (cycle 23 - purple squiggle),
but the new cycle (24) is not beginning as expected. Instead, the sun spots
are staying away. Notice how the predictions for solar cycle 24 have been
shifting, both further away and lower down. Even so, observations remain
below even the most dire prediction. We are obviously entering an area
of great uncertainty.
It
just so happens that the sun has ended a cycle (cycle 23 - purple squiggle),
but the new cycle (24) is not beginning as expected. Instead, the sun spots
are staying away. Notice how the predictions for solar cycle 24 have been
shifting, both further away and lower down. Even so, observations remain
below even the most dire prediction. We are obviously entering an area
of great uncertainty.
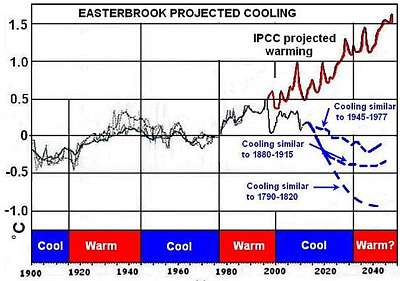 Predicting
the future is most frustrating because one will always be proved wrong.
The graph here shows actual temperature (black) already deviating substantially
from IPCC projections (red) since the late 1990s. Taking account of the
sun's declining activity, new scenarios can be projected (blue), according
to past cold periods. But it could become even colder for a longer period
than shown here. Quite evidently, humans do not have a significant effect
on Earth's temperature.
Predicting
the future is most frustrating because one will always be proved wrong.
The graph here shows actual temperature (black) already deviating substantially
from IPCC projections (red) since the late 1990s. Taking account of the
sun's declining activity, new scenarios can be projected (blue), according
to past cold periods. But it could become even colder for a longer period
than shown here. Quite evidently, humans do not have a significant effect
on Earth's temperature. Recently
more attention is paid to cosmic radiation originating from outside our
solar system. The graph here shows a strong correlation between temperature
(by its proxy oxygen-18) from calcite (CaCO3) in unpolluted cave stalagmites
(dripstones), and carbon-14 from tree rings of some very old trees. The
unstable isotope carbon-14 is produced in the upper atmosphere by cosmic
radiation, and the quantity produced, varies slowly with time. It decays
slowly and very predictively, such that after 5000 years, still about half
of it can be found. Thus any variation from the expected value must have
been caused by cosmic radiation. How it influences temperature, remains
a mystery for now.
Recently
more attention is paid to cosmic radiation originating from outside our
solar system. The graph here shows a strong correlation between temperature
(by its proxy oxygen-18) from calcite (CaCO3) in unpolluted cave stalagmites
(dripstones), and carbon-14 from tree rings of some very old trees. The
unstable isotope carbon-14 is produced in the upper atmosphere by cosmic
radiation, and the quantity produced, varies slowly with time. It decays
slowly and very predictively, such that after 5000 years, still about half
of it can be found. Thus any variation from the expected value must have
been caused by cosmic radiation. How it influences temperature, remains
a mystery for now. Cosmic
radiation in the form of neutrons reaching Earth, interferes with the atmosphere
in such a way that more cloud is formed when neutron radiation is less.
Why, is not understood. It appears that the solar wind influences the Earth's
magnetic field, while also shielding Earth from cosmic radiation. A change
in solar wind could explain the above two correlations.
Cosmic
radiation in the form of neutrons reaching Earth, interferes with the atmosphere
in such a way that more cloud is formed when neutron radiation is less.
Why, is not understood. It appears that the solar wind influences the Earth's
magnetic field, while also shielding Earth from cosmic radiation. A change
in solar wind could explain the above two correlations. Quite
recently [1] scientists have begun to see a link between cosmic particles
from distant stars as a major influence on Earth's climate. The Sun rotates
around its galactic centre (Milky Way) in around 226 million years (a solar
'year'). Because it travels faster than the arms of the Milky Way, it passes
through one arm every 140 million years. The arms are called Perseus,
Norma,
Scutum-Centaurus
and Sagittarius-Car). When our solar system is in such an arm, it
experiences a higher density of cosmic radiation than in the gaps in-between.
The cosmic ray flux in these spiral arms is ten times more intensive than
that of the sun, penetrating its protective solar wind and causing major
temperature changes on Earth. As the graph shows, there is a strong correlation.
Quite
recently [1] scientists have begun to see a link between cosmic particles
from distant stars as a major influence on Earth's climate. The Sun rotates
around its galactic centre (Milky Way) in around 226 million years (a solar
'year'). Because it travels faster than the arms of the Milky Way, it passes
through one arm every 140 million years. The arms are called Perseus,
Norma,
Scutum-Centaurus
and Sagittarius-Car). When our solar system is in such an arm, it
experiences a higher density of cosmic radiation than in the gaps in-between.
The cosmic ray flux in these spiral arms is ten times more intensive than
that of the sun, penetrating its protective solar wind and causing major
temperature changes on Earth. As the graph shows, there is a strong correlation. 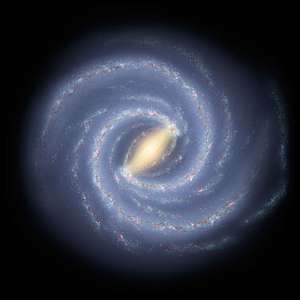
 Solar
radiation is not only affected by the gases in the atmosphere, but also
by volcanic activity and human activities. Large volcanic eruptions
have always had an effect on climate, mainly in the first year following,
and to a gradually lesser extent in the four years after that. The graph
shows how two recent volcanoes absorbed up to 20% of the sunlight, for
several years. The VEI number is a measure of the size of the eruption.
Solar
radiation is not only affected by the gases in the atmosphere, but also
by volcanic activity and human activities. Large volcanic eruptions
have always had an effect on climate, mainly in the first year following,
and to a gradually lesser extent in the four years after that. The graph
shows how two recent volcanoes absorbed up to 20% of the sunlight, for
several years. The VEI number is a measure of the size of the eruption.