.

Essential elements in living organisms

.


Abundance of elements from universe to humans
Element Universe
% [1]
Solar
system[4]
Crust
% [1/6|8]
River
ppm[5]
Ocean
ppm [2]
Marine
org %[2/8]
Micro
org %[7]
Plants
% [1/7|8]
Animals
[7]
Human 
food [3]
--
H
He
Li
B
C
N
O
F
Ne
Na
Mg
space
87
12
.
.
0.03
0.008
0.06
.
0.02
0.0001
0.0003
sun+plan
32000
2600
38ppm
6ppm
16.6
3
29
0.001
2.9
0.0418
1.046
mantle
3/.14
.
.
.|0.001
.1/.032
0.0001|0.1
49/45
.
0
0.7/2.3
8/2.8|0.5
water
110000
.
0.003
0.001
58.4
0.23
*
0.1
.
6.3
4.1
water
110000*
.
0.17
4.45
28.0/0.5*
15.5/0.67*
883000/6.0*
1.3
0.00012
10800*
1290
tissue
.
.
.
./0.002
.
./5
.
.
.
.
5.4/0.4
tissue
9.9
.
.
.
12.1
3.0
73.7
.
.
.
.
tissue
16/8.7
.
.
.|0.002
21/11
./0.8|2
59/78
.
.
0.01
0.04|0.2
tissue
9.3
.
.
.
19.4
5.1
62.8
.
.
.
.
food/day
.
.
.
.
100g
.
.
1-2mg
.
3000mg
300mg
Al
Si
P
S
Cl
K
Ca
Cr
0.0002
0.003
0.00003
0.002
.
0.000007
0.0001
.
0.0893
1.000
0.00932
0.6
0.001836
0.00158
0.045
0.005
2/8
14/27
0.07|0.07
0.7|0.07
.|1.4|0.01
0.1/1.7
2/5|1.4
.
0.4
1.32
0.02
6-11
7.8
2.3
15
0.001
0.001
2.9
0.088
904
19400*
392
411
 0.0002
.
.
./0.6
./1
./4
./1
18.6/0.5
20-800ppm/
.
.
0.6
0.3
.
.
.
.
0.001
0.1
0.03/0.7|0.2
0.02/0.1
.|0.01
0.1|1
0.1|1
.
.
.
0.6
0.6
.
.
.
.
.
.
1000mg
.
3000mg
3000mg
1000mg
0.005mg
Mn
Fe
Ni
Cu 
Zn
.
0.002
.
.
.
0.0025
0.117
0.026
0.0035
0.0008
.|0.09
18/6|3.8
.
.|0.002
.|0.005
0.007
0.7
.
0.007
0.02
0.0004
0.0034
0.0066
0.0009
0.005
10-600ppm/
./0.04
.
./0.005
./0.02
.
.
.
.
.
.|0.005
0.005|0.01
.
.|6ppm
.|0.02
.
.
.
.
.
5-10mg
15mg
.
1-2mg
.
Se
Br
Sr
Mo
Ag
Sn
I
.
.
.
.
.
.
.
.
.
13.5ppm
2.5ppm
0.26ppm
1.33ppm
0.46ppm
.
.
.
.|2ppm
.
.
.
.
0.02
0.06
.
.
.
.
0.00009
67.3
8.1
0.001
0.00028
0.00081
0.064
.
.
38ppm
.
0.2-3ppm
11pm
.
.
.
.
.
.
.
.
.
.
.|0.2ppm
.
.
.
.
.
.
.
.
.
.
0.1mg
.
.
0.2mg
.
.
0.1mg
Pt
Au
Hg
Pb
.
.
.
.
1.16ppm
0.13ppm
0.27ppm
2.2ppm
.
.
.
.
.
.
.
.
.
0.000011
0.00015
0.00003
.
.
.
20-500ppm
.
.
.
.
.
.
.
.
.
.
.
.
.
.
.
.
Note: 1000 ppm = 0.1%
 
References and notes
[1] Encyclopedia Britannica
[2] Turekian, Karl K:Oceans.1968. Prentice-Hall
[3] Stewart Truswell: ABC of nutrition. 1992. BMJ Publ.
[4] Cameron. Clark, S P(ed): Handbook of physical constants. 1966. Geol Soc Am. Abundance relative to Si.
[5] Turekian, Karl. Oceans.1968. C as HCO3; S as SO4; N as NO3, Si as SiO2.
[5] Turekian, Karl. in Oceanography, the last frontier. 1974
[6] Skinner, Brian J: Earth Resources. The numbers behind the slash (/) are Skinner's.
[7] Curtis & Barnes: Biology. 1989. Worth Publ. Plant: alphalpha; animal: human; microorg: bacterium.
[8] Larcher, W: Physiological plant ecology. 1980. Springer V. % by weight dried matter. Plants averaged over many groups.
(*) Oxygen and hydrogen as part of water. N2 dissolved versus/Nitrogen in cations. Carbon inorganic (CO2, etc)/ Dissolved Organic Carbon (DOC). Sodium and chlorine as salt.

-- seafriends home -- all about soil -- oceanography --


Relative abundance of elements in the universe
The above table of the abundance of the chemical elements in the universe, that are important for life, was composed to give more meaning to elements and nutrients. From left to right it roughly represents the evolution of the universe, the formation of Earth and the emergence and evolution of life. The data has been collected from various sources and as can be seen, there is sometimes considerable difference between these, but the overall picture becomes clear nonetheless. 
Note that some concentrations are given in the number of atoms, others in percentage by weight. For some elements such as P, K, Fe, this must be taken into account.
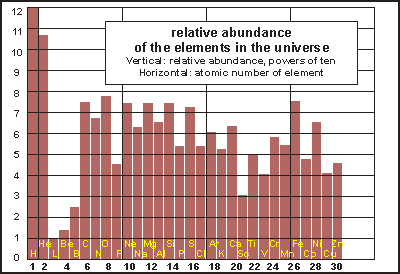
img: Relative abundance of elements in the universeIn the physical evolution of the planet, the heavier elements became more abundant as the solar system formed. The accompanying bar chart shows the relative abundances of the most important elements. Note that the vertical scale is logarithmic, each division representing a tenfold increase or decrease. 
The bar chart reveals the processes that synthesised heavier elements out of the hydrogen (H) and helium (He) of the Big Bang. Fusion in stars created more helium, skipped over lithium (Li), beryllium (Be) and boron (B) to carbon (C) and generated all the elements up to iron (Fe). Massive stars eventually explode as supernovas and their shockwaves make heavier elements than iron, but in very small amounts.
 
Abundance of elements in soil, sea and life
The sun and planets formed from the coagulation of cosmic dust and debris. Then the land crust emerged from mainly the lighter elements, which eroded into rivers to provide the elements in the sea. Early life then formed in the womb of the early oceans or brackish fresh water. Plants established on land, being capable of scavenging precious resources from the soil and to accumulate these in their tissues. Animals on land then evolved, feeding on the plants. Higher animals and carnivores, eventually humans, followed.

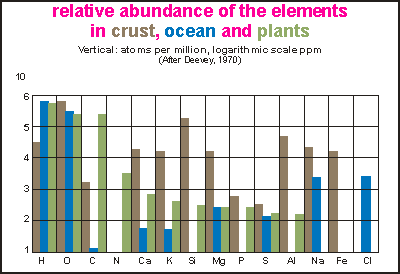
img: abundance of elements in land, sea and plantsThis bar chart shows one division for each element horizontally and abundance in a logarithmic scale, vertically. For each element, the concentrations for land (brown), sea (blue) and plants (green) is shown. In fact, the green data is the total of all life, but since the mass of plants far outweighs that of animals, it can be considered plants alone. Note that the concentration is in parts per million, counting atoms, not by weight. The top division is 1E6 or 100%, the bottom line is 1 ppm.

From the barchart, one can see that the elements H, O, Mg, S are plentiful in both soil and sea. Ca, K, Si, P, Al, Fe are plentiful in soil. The element N is in short supply in the soil whereas the elements C, N, Si, P, Al, Fe are in very short supply in the oceans. Note that the concentrations of the elements varies considerably from place to place on the land, whereas they are very equally distributed in the oceans, except close to continents and where upwellings occur. Note that plants produce their own requirement in C (carbon), by photosynthesis, both on land and in the sea. Note also that plants require hardly any salt (NaCl).
 

Nitrogen compounds are manufactured from air by bacteria in soils and by similar organisms (blue-green algae) in the sea, in quantities 'as the need arises'. Nitrogen-fixing is optimal at 20-30ºC (50-70 kg/ha/yr), drops in temperate regions (2-5 kg/ha/yr) and stops at 0ºC. Tropical reef algae can fix nitrogen at the rate of  30 kg/ha/yr. Symbiotic nitrogen fixing such as in the roots of peas and lupins, can produce much higher yields still (200 kg/ha/season).

The elements of which plants need most, are called macronutrients: N, P, S, Ca, Mg, Fe.
The required other elements are called trace elements or micronutrients: Mn, Zn, Cu, Mo, B, Cl.
In addition there are elements that are essential for only certain plant groups: Na for Chenopodiacea, Co for the Fabales with symbionts, Al for the ferns, Si for the diatoms, and Se for some planktonic algae. The nutrient requirements of agricultural plants have been studied in considerable detail, but much less so for wild plants and plankton. (Source [8])


One can see how some elements concentrated, others diluted. The most common elements of life are Carbon, Oxygen, Hydrogen and Nitrogen, all plentiful in the atmosphere, as shown in the table below. Other elements precious to life, such as sulfur and iodine also circulate through the atmosphere but in very small amounts.
 
Average composition of clean, dry air at the Earth's surface
Constituent Symbol Molecular
Weight
Molecular
fraction
Fraction
by mass
Nitrogen
Oxygen
Argon
Carbon dioxide
Neon
Helium
Methane
Krypton
Nitrous oxyde
Hydrogen
Ozone
N2
O2
Ar
CO2
Ne
He
CH4
Kr
N2O
H2
O3
28
32
40
44
20
4
16
84
44
2
48
78.09 %
20.95 %
0.93 %
320 ppm
18 ppm
5.2 ppm
2.9 ppm
1.1 ppm
0.5 ppm
0.5 ppm
0.01 ppm
75.5%
23.2 %
1.3 %
486 ppm
12 ppm
0.7 ppm
1.6 ppm
3.2 ppm
0.8 ppm
0.03 ppm
0.02 ppm
Water, moisture H2O 18 - -
Source: Garrels, MacKenzie and Hunt: Chemical cycles. 1975


World production and reserves
The table shows only 17 of the many elements used by society in manufacturing and agriculture, but they are the most important ones. As can be seen, a number of these have very short projected life times, most likely running out somewhere in the middle of this century.
World production and reserves statistics, 1995
material
production
kt
reserves
kt
life
yr
resources
kt
bauxite
chromium
cobalt
copper
iron ore
lead
manganese
nickel
tin
zinc
109,000
10,600
19.5
9,800
1,000,000
2,800
7,300
920
180
7,070
23,000,000
3,700,000
4,000
310,000
150,000,000
68,000
680,000
47,000
7,000
140,000
211
349
205
32
150
24
93
51
39
20
60,000,000
11,000,000
11,000
[1]  2,300,000
>800,000,000
1,500,000
large
130,000
large
1,800,000
gold
silver
platinum group
2.2
14
0.23
44
280
56
20
20
243
75,000
n.a.
100,000
gypsum
phosphate
potash
sulfur
103,000
137,000
26,200
52,000
large
11,000,000
8,400,000
1,400,000
long
80
320
27
large
large
250,000,000
5,000,000
Source: Mineral Commodity Summaries, 1996. US Bureau of mines.
Reserves include only currently economic deposits. Resources are low-concentration abundances.
[1] includes 0.7 Gt copper estimated to occur in manganese nodules, which also contain nickel.

Some elements can replace others. For instance, where copper is used extensively in electrical cabling, it can be replaced by aluminium. Gold and silver are more difficult to replace and phosphate rock and sulphur will be limiting the green revolution, since they are an important part of artificial fertilisers. Whereas nitrogen fertiliser can be made from air at the cost of about 1kg coal per kg of active nitrogen, it needs to be applied with 10-15% phosphorus and sulphur in order to be effective.

 .


-- home -- Use the BACK button on your browser to exit.
For best printing, set your left and right page margins to minimal.