| Although freshwater lakes were not of direct concern to us, we hoped that seen through the 'eyes' of the Dark Decay Assay, they could further our understanding. Freshwater planktonic ecosystems are much simpler than their marine equivalents, and this could help us make a number of new discoveries (see method.htm). This document follows a number of freshwater lakes through their seasons, recording how various parameters change. |
| Rate of Attack
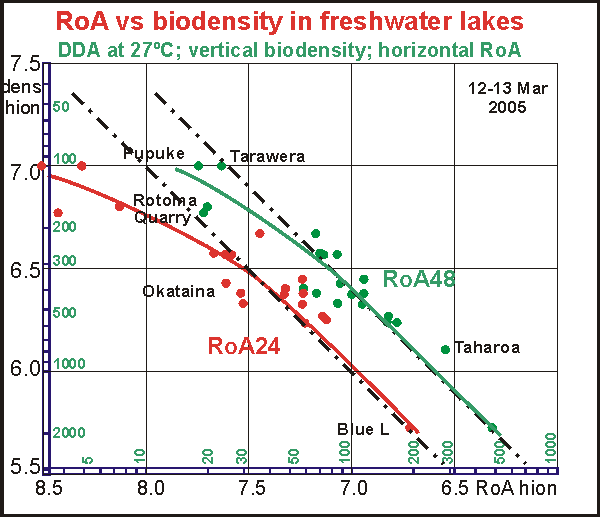
When the rate of attack (over 48 hours, green) is plotted versus biodensity, an almost straight line results (green), implying that bacterial attack rate in 48 hours is a constant part (27% at 27ºC) of the measured biodensity but less for low biodensities. (Note that the black dash-dot line gives precise linearity) |
 |
| Biodensity vs natural pH
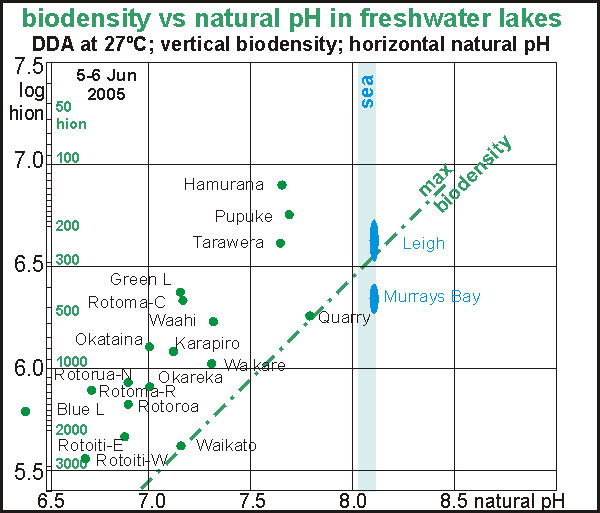
The maximum biodensity a lake can carry when it is fully eutrophied, is a function of its natural pH, following the dash-dot line in the graph. Note that the winter data, enhanced by alcohol, show larger biodensities but the maximum biodensity line remains at the same position. Due to the technique of alcohol enhancement, this grap has now become less relevant.
|
| Visibility vs biodensity
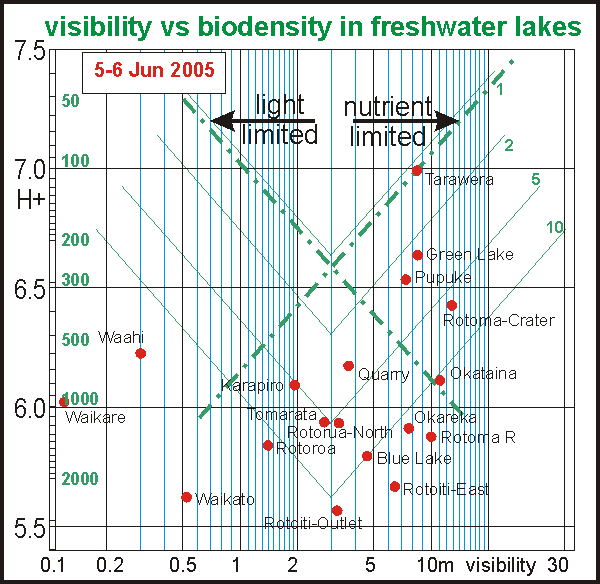
In the visibility versus biodensity plot phytoplankton has two regions, depending on whether it is limited by nutrients or by light. The thin chevrons show biodensities of 1,2, 5 and 10 times that estimated for phytoplankton. For instance, Blue Lake has a biodensity about 8 times that of the phytoplankton, most of which made up of decomposers. Note that because alcohol enhancement was not used, biodensities shown have not reached their ultimate values.
|
|
|
date.time: date and time as yyyymmdd.hhmm, denoting the moment the vials were confined to darkness. viz: underwater visibility measured vertically where possible and where not, horizontally. In most cases by entering the water with dive mask and measuring tape and swimming out till the water clears. ipH: initial pH, measured at the time of collection +/-: initial pH less natural pH, in hion. This indicates producer gain (+) or bacterial gain (-). = ALOG(-npH) - ALOG(-ipH) ppb fpH: final pH, the lowest pH measured on day 9 or 13 when the decomposition curves have flattened or begin rising again. apH: the final pH after alcohol enhancement, when done after final pH is reached. npH: natural pH measured after one week of ventilation with the air. The highest value measured. bio: the biodensity calculated from initial and ending pH in hions without alcohol enhancement. abio: the biodensity with alcohol enhancement, in this experiment after day 9. RoA48: the biodensity (hion) decomposed in the first 48 hours, calculated from the curves and initial pH. RoA24: the biodensity (hion) decomposed in the first 24 hours. Notes: *= measured later on a calm day |
| site | ref | date.time | viz | ipH | +/- | fpH | apH | npH | bio | abio | RoA48 | RoA24 |
| Pupuke Quarry Lake | X | 20050605.0900 | 2.5 | 8.04 | +6.7 | 7.10 | 6.24 | 7.80 | 70 | 566 | 29 | 12.3 |
| Lake Pupuke | Y | 20050605.0910 | 8.3 | 8.28 | +16 | 7.21 | 6.70 | 7.68 | 56 | 194 | 21.7 | 9.2 |
| Waikato River @ Mercer | W | 20050605.1000 | 0.5 | 7.14 | -2 | 6.41 | 5.61 | 7.15 | 317 | 2382 | 196 | 97 |
| Lake Waikare | V | 20050605.1040 | 0.10 | 8.57 | +46 | 6.52 | 6.02 | 7.31 | 299 | 952 | 118 | 40 |
| Lake Waahi | U | 20050605.1125 | 0.30 | 7.98 | +39 | 6.54 | 6.22 | 7.31 | 278 | 592 | 69 | 25 |
| Lake Rotoroa Hamilton Lake | T | 20050605.1215 | 1.4 | 7.54 | +100 | 6.46 | 5.79 | 6.89 | 318 | 1593 | 170 | 78 |
| Lake Karapiro | S | 20050605.1330 | 1.9 | 7.84 | +61 | 6.63 | 6.08 | 7.12 | 220 | 817 | 98 | 39 |
| Lake Rotoma (road side) | R | 20050605.1510 | 10.0 | 7.23 | +132 | 6.52 | 5.86 | 6.72 | 243 | 1322 | 127 | 59 |
| Lake Rotoehu | Z | 20050605.1535 | 2.5 | 6.68 | -174 | 6.80 | 6.32 | 7.46 | - | 320? | - | - |
| Lake Rotoma (crater) | A | 20050605.1615 | 12.5 | 7.71 | +48 | 6.67 | 6.40 | 7.17 | 194 | 379 | 88 | 51 |
| Lake Rotoiti East | B | 20050605.1650 | 6.4 | 7.14 | +62 | 6.21 | 5.68 | 6.87 | 544 | 2017 | 210 | 75 |
| Lake Okataina | C | 20050606.1300 | 10.8 | 7.78 | +118 | 6.39 | 6.10 | 7.01 | 391 | 778 | 79 | 22 |
| Lake Rotoiti West | D | 20050606.1340 | 3.2 | 7.21 | +143 | 6.03 | 5.55 | 6.69 | 872 | 2756 | 285 | 138 |
| Hamurana Springs | E | 20050606.1400 | >30 | 6.65 | -175 | 6.45 | 6.46 | 7.31 | 131 | 123 | - | - |
| Hamurana Springs aq culture | Ea | 2005 | - | 7.74 | +328 | - | 6.46 | - | - | 723 | 123 | 32 |
| Lake Rotorua north | F | 20050606.1350 | 3.2 | 7.49 | +99 | 6.32 | 5.92 | 6.88 | 446 | 1170 | 219 | 150 |
| Lake Rotorua City end | G | 20050606.1200 | 2.6 | 6.12 | -360 | 5.81 | 5.66 | 6.40 | 790 | 1429 | - | - |
| Lake Okareka | H | 20050606.0940 | 7.6 | 7.41 | +59 | 6.47 | 5.90 | 7.01 | 300 | 1220 | 93 | 32 |
| Blue Lake Tikitapu | I | 20050606.1140 | 4.7 | 6.67 | +208 | 5.81 | 5.74 | 6.38 | 1335 | 1606 | 265 | 125 |
| Lake Tarawera | J | 20050606.1020 | 8.6 | 8.02 | +13 | 6.96 | 6.59 | 7.64 | 100 | 247 | 33 | 13.4 |
| Green Lake | K | 20050606.0955 | 4.2 | 7.46 | +37 | 6.48 | 6.35 | 7.15 | 296 | 412 | 72 | 28 |
| Lake Tomarata | L | 20050623.1845 | 2.6 | 7.34 | - | - | 6.14 | - | - | 1185 | 113 | 50 |
| Lake Taharoa (Kai Iwi lakes) | M | 20050 | 11.0 | 6.46 | - | |||||||
| Lower Nihotupu Dam drinkwater | N | 20050 | - | 7.78 |
 As
a result of more complete decomposition, the relationship between Rate
of Attack and biodensity gave quite a different picture, although the strict
linear relationship remains. Instead of Blue Lake, both Rotoiti East and
West and the Waikato River had highest biodensities, followed by Blue Lake
and (surprisingly) Lake Rotoma at the road side. Apparently a large
amount of sewage enters here or the small quantity that enters, is not
easily diffused into the lake. However, Rotoma-crater showed higher than
normal rates of attack, together with Green Lake and Rotorua-north. On
the other side of the line the lakes Quarry, Okataina and Okareka had substantially
lower rates of attack. We think that the results obtained with alcohol
enhancement paint a better picture of the comparative health of these lakes.
Note that the 'healthy' lakes Pupuke and Tarawera now show the RoA expected
from their biodensities, 11% and 4.5% respectively. As
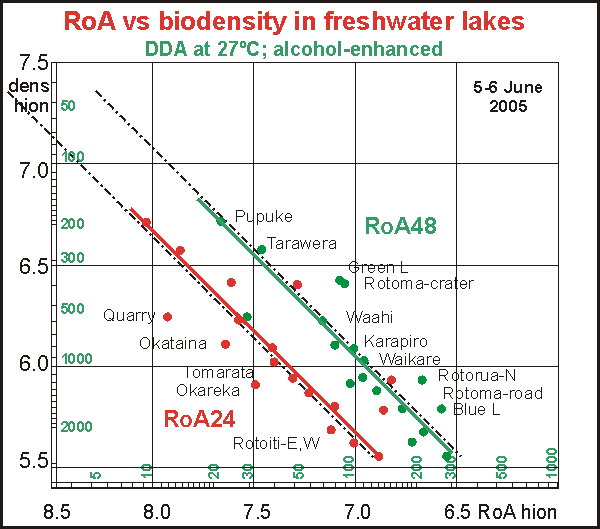
a result of more complete decomposition, the relationship between Rate
of Attack and biodensity gave quite a different picture, although the strict
linear relationship remains. Instead of Blue Lake, both Rotoiti East and
West and the Waikato River had highest biodensities, followed by Blue Lake
and (surprisingly) Lake Rotoma at the road side. Apparently a large
amount of sewage enters here or the small quantity that enters, is not
easily diffused into the lake. However, Rotoma-crater showed higher than
normal rates of attack, together with Green Lake and Rotorua-north. On
the other side of the line the lakes Quarry, Okataina and Okareka had substantially
lower rates of attack. We think that the results obtained with alcohol
enhancement paint a better picture of the comparative health of these lakes.
Note that the 'healthy' lakes Pupuke and Tarawera now show the RoA expected
from their biodensities, 11% and 4.5% respectively.
The lakes located to the right of the line have aggressive decomposers (Green Lake, Rotoma-crater, Rotorua, Blue Lake) whereas those to the left more benign ones (Quarry, Okataina, Okareka) |
 For
unknown reasons the natural pH in this batch of samples showed high variability,
which required averaging over two days. The resulting scatter diagram shows
that most lakes have veered off the maximum biodensity line towards a lower
biodensity with lower natural pH. We suspect that these shifts are seasonal
and that both a low temperature and low light levels have caused it. Because
alcohol enhancement was applied to this batch, it cannot be compared with
the first one. Further seasonal monitoring may show how these lakes behave. For
unknown reasons the natural pH in this batch of samples showed high variability,
which required averaging over two days. The resulting scatter diagram shows
that most lakes have veered off the maximum biodensity line towards a lower
biodensity with lower natural pH. We suspect that these shifts are seasonal
and that both a low temperature and low light levels have caused it. Because
alcohol enhancement was applied to this batch, it cannot be compared with
the first one. Further seasonal monitoring may show how these lakes behave. |
 The
picture emerging from DDA with alcohol enhancement looks quite different
from that of March as hidden biomass is now revealed. It leaves Tarawera
at the top but places the Waikato River and Lake Rotoiti at the bottom,
suggesting that these three have the largest bacterial load of all. Blue
Lake remains in its position but Okareka and Okataina have joined as lakes
with very high bacterial biodensity compared to their phytoplankton biodensity.
A lake like Okataina for instance, with winter visibility of 7-8m, supports
over 10 times the biomass estimated for its phytoplankton. The
picture emerging from DDA with alcohol enhancement looks quite different
from that of March as hidden biomass is now revealed. It leaves Tarawera
at the top but places the Waikato River and Lake Rotoiti at the bottom,
suggesting that these three have the largest bacterial load of all. Blue
Lake remains in its position but Okareka and Okataina have joined as lakes
with very high bacterial biodensity compared to their phytoplankton biodensity.
A lake like Okataina for instance, with winter visibility of 7-8m, supports
over 10 times the biomass estimated for its phytoplankton.
We think that this scatter diagram is more representative of the health of these lakes but more work needs to be done. |