
| About New Zealand, its history relating to agriculture and its dependence on agricultural exports. | ||
| New Zealand's tectonic drift over 200 million years, geology, climate, soils and land cover. | ||
| New Zealand's most fertile soils were once covered in native forests of slow growing podocarp trees. Deep subsoils with shallow topsoils formed, which are susceptible to erosion. | ||
| The Minister for the Environment has made a strategy for sustainable land management, which consists of forming local care groups, education and voluntary action. Farmers are adopting a voluntary code of practice for handling and applying fertilisers. But will it help? |
| books
& reports |
The publications listed in blue
are available from the Seafriends Library.
MfE: Sustainable land management, a strategy for New Zealand. June 1996; ME 201. MAF: Agriculture and forestry in New Zealand - an overview. MAF: Control of soil erosion on farmland. by D L Hicks. MAF Policy Technical Paper 95/4. Aug 1995. MAF: New Zealand Agriculture. 1974. FertResearch: Code of Practice for fertiliser use. 1998. Federated Farmers of NZ: Sustainable agriculture manual. 1994. Molloy, Les: The living mantle: soils in the New Zealand landscape. 1988, 1998. Statistics NZ: The NZ official yearbook 1997 (100th edition) and 2000 (centennial edition) |
|
| NZ
internet links |
MfE: Ministry for
the environment looks at broader issues such as water quality and global
warming and administers the Resource Management Act (RMA).
MAF: Ministry of Agriculture and Forestry (MAF) creates opportunity for, and manages risk to, New Zealand's food, fibre, forestry and associated industries. Agresearch: the life sciences link between the past of pioneering and the better future where our products will improve the quality of life and the environment around the world in a responsible and sustainable way. Science education section. Landcare Research: Landcare Research is an independent Crown Research Institute which focuses on management of land resources for conservation and for primary production. Science section. SINDI Soil Indicator assessment tool. Soil Quality section. HortResearch: New Zealand's largest horticulture and food research organisation. Hort-net: an information centre for NZ's plant-based industries. FertResearch: NZ Fertiliser Manufacturers' Research Association. Links to agricultural resources. Crop and Food Research: provides quality research, technologies and services for arable foods, vegetable foods, seafood, ornamentals, animal feed, plant products and forestry. Forest Research: New Zealand Forest Research Institute Limited GNS: Institute of Geological & Nuclear Sciences; earth and nuclear scientific research (IGNIS). ESR: Institute of Environmental Science and Research. MED: Minister for Economic Development and its section on NZ minerals. NZ treasury: the Government's lead adviser on economic and financial policy. Our work is aimed at helping governments achieve higher living standards for New Zealanders. NZ Statistics: Statistics New Zealand is the national statistical office. |
History New
Zealand is a young country, only just over 150 years old. In 1840, its
founding document, the Treaty of Waitangi, was signed by representatives
of Maori tribes and the Queen. At that time, about 2000 white men (pakeha)
lived in NZ, but its population rose steadily to reach 3.8 million in 1999
(2 million in 1950). With a surface area of 26.7 million hectares, each
New Zealander has 7.0 ha as living space (USA= 940Mha/290M= 3.2 ha each;
Holland= 0.2). But only 3.2 ha of productive land is available for every
person. With a coastline of 15,000 km, each inhabitant has 3.95 m, while
never living further than 130 km away from the sea. New
Zealand is a young country, only just over 150 years old. In 1840, its
founding document, the Treaty of Waitangi, was signed by representatives
of Maori tribes and the Queen. At that time, about 2000 white men (pakeha)
lived in NZ, but its population rose steadily to reach 3.8 million in 1999
(2 million in 1950). With a surface area of 26.7 million hectares, each
New Zealander has 7.0 ha as living space (USA= 940Mha/290M= 3.2 ha each;
Holland= 0.2). But only 3.2 ha of productive land is available for every
person. With a coastline of 15,000 km, each inhabitant has 3.95 m, while
never living further than 130 km away from the sea. |
This map shows NZ's latitudinal position relative to other places in
the world. Located in the temperate climate zone, NZ has a sea climate
with moderate to high rainfall and few weather extremes. It is one of the
few places on Earth where rain falls in all seasons. Orientated in a north-south
direction between latitudes 34ºS and 47ºS, the two main islands
experience a temperature gradient of about 7 degrees, which is also the
average difference between summer and winter. NZ has a climate conducive
to farming. See also
Oceanography/Why
NZ is so special.
| Farming in NZ was spurred by the needs of a fixed overseas market of 40 million people: Great Britain. NZ almost became an extension of the British economy, 'Britain's offshore farm'. With a per capita Gross Domestic Product (GDP) only exceeded by Switzerland, NZ enjoyed high prosperity until the early 1970s. But England's entry into the European Economic Community, closed that market and NZ had to find other destinations for its farming produce. The changeover depressed incomes and exposed the nation to the fluctuations of world markets, perhaps like no other nation, for the world grows far more food locally, than is traded internationally. It would be fair to say that world trade consists mainly of excess food in good years, which depresses demand and with it, prices. It suggests that the world has enough meat, hides and butter. Successive governments have encouraged other sectors of the economy to develop, often to the detriment of the agricultural base. NZ's recent globalisation since 1984, removed farm subsidies and has driven many exporters overseas or to wind up, resulting in a worrying current account deficit of 30-40% of export income, and rising steeply. The past 15 years has seen an economic growth based on foreign investment to the tune of NZ$ 100M, or 110% of GDP, requiring interest and dividend payments exceeding NZ$ 7700M. GDP per capita is now close to the lowest of the developed countries. NZ cattle and sheep numbers declined by 24%. |
|
| Since
1984, NZ has unilaterally removed its support to farmers. Government assistance
to farmers is very low by international standards. NZ farmers have the
OECD's lowest producer support rates. The producer support rate in Australia
is 3x greater, in the USA 5x, and many times greater in the EU, Norway,
Switzerland and Japan.
In order for a dairy farmer to remain economic, he must milk over 230 cows twice daily. A sheep farmer has 2000-3000 sheep. A beef farmer has over 500 steers. |
Nothing can change the fact that NZ remains eminently suitable for producing
exports from solar inputs. As the table above shows, over half of its export
income comes from agriculture and fisheries, a sound sustainable base which
earns little in a world awash with food, but perhaps more in the future
world of scarcity.
The diagram below gives a breakdown of NZ's agricultural base today,
compared with 30 years ago. Dairy production increased while that of sheep
and cattle decreased. NZ has about 45 million sheep and 8 million cattle
(of which 4.6M beef cattle).
New Zealand's natural advantages are:
| Once wholly covered in forest and scrubland,
present-day land cover reflects the intensity with which NZ has been developed,
leaving only 33% of its original vegetation intact (red colour in the table).
Although the tussock lands still have their original land cover, they are
grazed heavily, causing ecological problems.
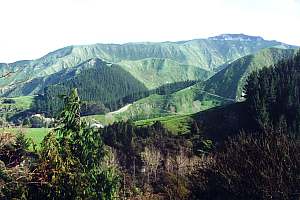
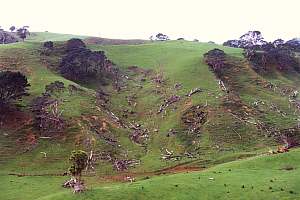
Taking advantage of the rich, deep forest soils, the steep hill country has been deforested, but after less than a century of farming, these soils have lost their productivity and grass cover, causing serious erosion. Fortunately many of these degraded soils can be salvaged by planting forests of radiata pine (Pinus radiata, originating from California). 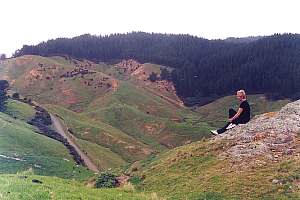 |
|
In 1991 New Zealand introduced the Resource Management
Act (RMA) and created a new Ministry for the Environment to administer
it. The RMA is about using resources in a way that provides for the social,
economic and cultural wellbeing of people, while safeguarding the environment
for ourselves and future generations. Local government (regional and local
bodies) are responsible for making it work. The RMA requires many activities
to be sustainable, to obtain a Resource Consent and to produce an Environmental
Impact Assessment, often leading to excessive bureaucracy. The MfE produces
sustainable strategies for every resource type, and local bodies produce
plans for making it work. The RMA has seriously started NZ on the road
to a sustainable society even though many have doubts.
 The
history of agriculture in NZ is best illustrated by the four graphs in
the diagram. The black curve shows NZ population steadily climbing, accelerating
slightly after World War II. Sheep numbers and cattle (not shown) kept
pace, almost at the same rates of growth. Since NZ's welfare depends mainly
on agricultural exports, the number of sheep per person has always been
a critical measure of it. However, since 1986 when the subsidy on fertilisers
was abolished, the number of sheep have declined drastically, from a high
of 70 million to 49 million in 1995 and 45 million in 1999. Over the same
period, nearly 5 Mha (25%) out of a total 21.25 Mha in 1981, has been taken
out of production. It corresponds roughly to the expected degradation of
around 30% over 15 years, by not applying fertilisers. The red curve of
total fertiliser use, shows a drop of nearly 50%. Considering that the
more prosperous dairy farms were not affected, most of the effect of reduced
fertiliser application was felt by the hill country, which is most prone
to erosion. The
history of agriculture in NZ is best illustrated by the four graphs in
the diagram. The black curve shows NZ population steadily climbing, accelerating
slightly after World War II. Sheep numbers and cattle (not shown) kept
pace, almost at the same rates of growth. Since NZ's welfare depends mainly
on agricultural exports, the number of sheep per person has always been
a critical measure of it. However, since 1986 when the subsidy on fertilisers
was abolished, the number of sheep have declined drastically, from a high
of 70 million to 49 million in 1995 and 45 million in 1999. Over the same
period, nearly 5 Mha (25%) out of a total 21.25 Mha in 1981, has been taken
out of production. It corresponds roughly to the expected degradation of
around 30% over 15 years, by not applying fertilisers. The red curve of
total fertiliser use, shows a drop of nearly 50%. Considering that the
more prosperous dairy farms were not affected, most of the effect of reduced
fertiliser application was felt by the hill country, which is most prone
to erosion. |
The green curve shows the number of hectare planted in forest, during the century. In the Great Depression years (1925-1935), the Government planted large areas of pumice soils (the Kaingaroa Forest) in pine forests, which provided the timber for sawmilling, pulp and paper forty years later. Between 1965 and 1985, when the state forests came on stream, it was clear that forestry was a viable business in NZ, inviting both Government and private plantings. After 1984 when tax rebates were phased out, new plantings declined sharply, and Government plantings dropped to zero because all cutting rights had been sold to private interests. Very recently, forest plantings have reached new heights in anticipation of higher prices and a high demand by the paper industry. Also many farmers are now retiring their degraded lands and planting these in pine forests (14,000 forests of less than 100 ha). In 1995, 5.3 million cubic metre of timber was milled for sawlogs, against 4.1 for pulp & paper and 4.8 for export. Total domestic processing was 11.1 million cum in 1996.
Geology About
200 million years ago (200Mya), Gondwanaland started to break up, allowing
the continents to drift towards their present positions. New Zealand was
part of the Rangitata land mass, adjacent to Australia and Antarctica.
Most of the sedimental rock came from eroding Antarctica. About
200 million years ago (200Mya), Gondwanaland started to break up, allowing
the continents to drift towards their present positions. New Zealand was
part of the Rangitata land mass, adjacent to Australia and Antarctica.
Most of the sedimental rock came from eroding Antarctica.
By 110 Mya, India, Africa and South America were well separated from Antarctica. By 80 Mya, the Rangitata 'continent' which included New Caledonia at its northernmost tip, started to peel off. In the meantime it had drifted some 90 degrees around the South Pole, but now it was heading in a northerly direction. The southern floe of Rangitata broke and started to rotate counter-clockwise, pushing what is now the South Island, along the Alpine Fault onto the North Island, while continuing its rotation. |
This 'Alpine Fault' which runs the length of the South Island, is also
the boundary between the Indo-Australian (north) and the Pacific (south)
ocean plates. Along their boundaries runs the Hjort Trench, the Puysegur
Trench, flanked by the Macquarie Ridge, south of NZ , and the Hikurangi
Trench and Kermadec Trench, flanked by the Kermadec Ridge, to the north
of NZ.
 As
the South Pacific plate slid against the Indo-Australian plate, it pushed
up the Southern Alps, deforming the rocks, which matamorphosed to schists
(grey colour). The oldest rock (granite) is found in the South Island,
dating back to the late Cretaceous (70 Mya, million years ago). The metamorphic
rocks (greywacke) that pushed up the Southern Alps, consist of Antarctic
sediment dating back to when NZ was still connected to it. As
the South Pacific plate slid against the Indo-Australian plate, it pushed
up the Southern Alps, deforming the rocks, which matamorphosed to schists
(grey colour). The oldest rock (granite) is found in the South Island,
dating back to the late Cretaceous (70 Mya, million years ago). The metamorphic
rocks (greywacke) that pushed up the Southern Alps, consist of Antarctic
sediment dating back to when NZ was still connected to it. |
The NE part of the South Island is still shifting SE-wards along the
(red) alpine fault. At some stage in the Tertiary period (20 Mya), it pushed
up an island arc of volcanoes (dark brown). Volcanoes of that age are also
found in the northern tip of the North Island. Later volcanic activity
moved gradually SE-wards (Little Barrier, Great Barrier, Auckland, Coromandel)
and present volcanic activity is found in the central plateau from Lake
Taupo to White Island (dotted red line). The old sedimentary rocks are
hard greywacke. On top of these base rocks, alluvium was deposited and
soils formed according to local climate and vegetation.
 Moisture
from rainfall is an important factor in soil formation and agriculture.
This rainfall map shows that NZ has a moist climate, with the ideal amount
of rain between 1 and 2m (1000-2000mm) annually, but there are some exceptions.
All mountain ranges capture more rain (2-3m) and the west coast of the
South Island captures up to 8m annually. As we have seen in previous chapters,
areas of high rainfall are very difficult to exploit in a sustainable way,
but fortunately, most have been left in their original native forest cover
(see map below). Around the settlement of Alexandra, back from Dunedin
on the South Island, occurs a desert pocket with low rainfall. The prevailing
westerlies unload their rains on the West Coast, leaving most of the South
Island drier than the North Island. Moisture
from rainfall is an important factor in soil formation and agriculture.
This rainfall map shows that NZ has a moist climate, with the ideal amount
of rain between 1 and 2m (1000-2000mm) annually, but there are some exceptions.
All mountain ranges capture more rain (2-3m) and the west coast of the
South Island captures up to 8m annually. As we have seen in previous chapters,
areas of high rainfall are very difficult to exploit in a sustainable way,
but fortunately, most have been left in their original native forest cover
(see map below). Around the settlement of Alexandra, back from Dunedin
on the South Island, occurs a desert pocket with low rainfall. The prevailing
westerlies unload their rains on the West Coast, leaving most of the South
Island drier than the North Island. |
 Soils
developed from the bedrock under the influence of climate and vegetation.
Clays and loams developed from both sedimentary rocks (yellow-brown, yellow-grey
and grey-brown earths) and volcanic rocks (yellow-brown loams and red-brown
loams). The red-brown and yellow-brown volcanic loams are the most fertile
soils, used for market gardening and intensive dairy farming. They are
mainly found in the North Island. The Central Plateau around Lake Taupo
is covered in yellow-brown pumice soils. Taupo's most recent eruptions
happened 30,000 and 1800 years ago, the latest eruption leaving hardly
enough time to form a new soil profile, one reason why this area is not
very suitable for farming. The other reason is the lack of trace elements
like cobalt, important for animal health. Soils
developed from the bedrock under the influence of climate and vegetation.
Clays and loams developed from both sedimentary rocks (yellow-brown, yellow-grey
and grey-brown earths) and volcanic rocks (yellow-brown loams and red-brown
loams). The red-brown and yellow-brown volcanic loams are the most fertile
soils, used for market gardening and intensive dairy farming. They are
mainly found in the North Island. The Central Plateau around Lake Taupo
is covered in yellow-brown pumice soils. Taupo's most recent eruptions
happened 30,000 and 1800 years ago, the latest eruption leaving hardly
enough time to form a new soil profile, one reason why this area is not
very suitable for farming. The other reason is the lack of trace elements
like cobalt, important for animal health.
The South Island is characterised by bare mountain peaks, yellow-brown high country soils covered in tussock, lowland yellow-grey soils for intensive farming and cropping, and pockets of arid grey-brown earths in central Otago. |
 The
vegetation map shows today's vegetation. The dunes, pasture, high-quality
pasture and tussock are all grazed. Native forests remain only on the mountain
ranges where farming is impractical. The highest mountains are covered
in alpine vegetation or bare rock. Mountain tussock grass is found mainly
on the South Island's high country. The
vegetation map shows today's vegetation. The dunes, pasture, high-quality
pasture and tussock are all grazed. Native forests remain only on the mountain
ranges where farming is impractical. The highest mountains are covered
in alpine vegetation or bare rock. Mountain tussock grass is found mainly
on the South Island's high country.
This map does not do justice to the many plantation forests, which are scattered all over NZ. The large plantation forests near Lake Taupo were planted in the years of the Great Depression. |
Erosion On
its 60 million journey of isolation, NZ developed a unique flora and with
it a fauna consisting mainly of birds, and soils resulting from this. The
native forests are characterised by very slow growing trees (podocarp)
which keep their foliage in winter. Podocarps are an evolutionary invention
in between pinetrees and leafy trees. Their wood is also in between softwood
(pine) and hardwood (leafy trees). Their slow metabolic rate and dense
leaf litter caused soils to erode slowly, resulting in deep subsoils with
thin top soils but thick litter layers. On
its 60 million journey of isolation, NZ developed a unique flora and with
it a fauna consisting mainly of birds, and soils resulting from this. The
native forests are characterised by very slow growing trees (podocarp)
which keep their foliage in winter. Podocarps are an evolutionary invention
in between pinetrees and leafy trees. Their wood is also in between softwood
(pine) and hardwood (leafy trees). Their slow metabolic rate and dense
leaf litter caused soils to erode slowly, resulting in deep subsoils with
thin top soils but thick litter layers.
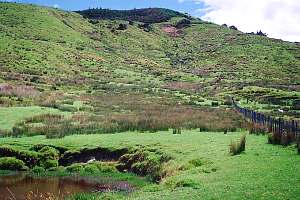
After milling and burning of the forest, the litter layer disappeared and the thin top soil was farmed for grassland. Grassland has a high metabolic rate, which requires soils and their organisms to adapt. In general, NZ soils are acidic, low in sulphur and phosphate and some trace elements. As can be expected, application of fertiliser boosts their fertility by 50%. |
Because of their initial fertility, farmers were wrongly led to believe
that steep hill country could be farmed sustainably. Driven by false expectations
and often by poverty and the need to survive, farmers turned steep forests
into pasture. Half a century later, these soils started eroding badly,
requiring them to be reforested as a last resort.
Scientists estimate the loss of soil in New Zealand, through erosion and transport by rivers to the sea at 400 million ton per year. It arises mainly from the 22 million hectare of cultivated land, averaging 18 t/ha or 10 - 20 times the rate of natural soil formation. It is vastly unsustainable.
[see also the principles of degradation for details of NZ soil statistics]
 |
 |
 |
 |
 NZ
pasture consists of various grasses, dominated by ryegrass, mixed with
clovers. Bacteria in the clover's root nodules bind nitrogen from air,
providing all the nitrogen needed. Pastures are fertilised with lime (to
lower acidity), sulphur and phosphate. Most farmers feed missing trace
elements in the form of enriched salt lick blocks (copper, cobalt, selenium). NZ
pasture consists of various grasses, dominated by ryegrass, mixed with
clovers. Bacteria in the clover's root nodules bind nitrogen from air,
providing all the nitrogen needed. Pastures are fertilised with lime (to
lower acidity), sulphur and phosphate. Most farmers feed missing trace
elements in the form of enriched salt lick blocks (copper, cobalt, selenium).
The climate is kind enough to leave stock outside during winter and summer. The diagram shows the typical cycle in the productivity of a typical NZ farm. Grass growth peaks in spring (Oct/Nov) and once again in autumn (Mar/Apr). Nature times calving and lambing with the spring flush of grass, requiring only 3 months of feed supplements. These are provided in the form of hay or silage, harvested in early summer when grass growth exceeds demand, or by leaving tall grass on some reserved paddocks. Often in remote areas, stock is allowed to graze road sides. Note that grass productivity varies from year to year and month to month, depending on the weather. |
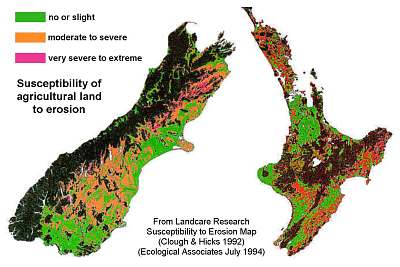 The
map on the right shows farmed land in NZ, and its susceptibility to erosion.
Such susceptibility depends mainly on slope and land use, but to some extent
also on the quality of the soil. The black areas on the map are not farmed.
As one can see, a vast area is moderately to severely susceptible to erosion.
such lands may well need to be reforested, which would reduce livestock
far below the levels of today. It is feared that world reforestation efforts
for the sake of carbon dioxide emission credits, could depress the price
of timber in the foreseeable future. The
map on the right shows farmed land in NZ, and its susceptibility to erosion.
Such susceptibility depends mainly on slope and land use, but to some extent
also on the quality of the soil. The black areas on the map are not farmed.
As one can see, a vast area is moderately to severely susceptible to erosion.
such lands may well need to be reforested, which would reduce livestock
far below the levels of today. It is feared that world reforestation efforts
for the sake of carbon dioxide emission credits, could depress the price
of timber in the foreseeable future. |
Towards sustainabilityLand use in NZ over the last 150 years has resulted in significant, and sometimes severe, environmental problems. Because NZ depends so much on its agriculture, unsustainable land management has far-reaching effects on our economy and way of life. In 1996 the NZ Government pledged to give priority to developing and implementing a Sustainable Land Management strategy (SLM) for NZ. |
The SLM strategy aims to:
 The
diagram shows the proposed management and reporting structure, originating
from the ministers for the Environment and other departments. Since local
and regional Government is responsible for administering the Resource Management
Act, they are also responsible for implementing the SLM. By stimulating
and creating local care groups (land care, harbour care, dune care, river
care, etc.), a growing number of people is becoming aware of and involved
with SLM. Most communication happens between Regional Councils and the
care groups, with information flowing between them, but mostly from the
top downward. The SLM Contact Group oversees the development and
implementation and reports back to the Ministers. The Regional Council
Policy Managers Forum reviews the approaches taken by councils in their
preparation of policies and plans under the RMA. The
diagram shows the proposed management and reporting structure, originating
from the ministers for the Environment and other departments. Since local
and regional Government is responsible for administering the Resource Management
Act, they are also responsible for implementing the SLM. By stimulating
and creating local care groups (land care, harbour care, dune care, river
care, etc.), a growing number of people is becoming aware of and involved
with SLM. Most communication happens between Regional Councils and the
care groups, with information flowing between them, but mostly from the
top downward. The SLM Contact Group oversees the development and
implementation and reports back to the Ministers. The Regional Council
Policy Managers Forum reviews the approaches taken by councils in their
preparation of policies and plans under the RMA.
Focus Groups will be convened to address specific policy or technical issues related to SLM. These groups will be task-oriented, have specific terms of reference related to the task, and will be disbanded once the work has been completed. The Landcare Trust is an organisation facilitating this process. It will train a national network of Landcare and community group facilitators and encourage the establishment of Landcare groups. The scientific support side stimulates the kinds of research that can be done towards SLM, assisted by a flow of funds. Care groups can be involved in various research projects. |
Problem areas that have so far been identified for priority action are:
Monitoring and review will be undertaken
to ensure that tangible results are achieved over time: