,
HAURAKI GULF MARINE SURVEY January to August 1993
Dr J Floor Anthoni
Leigh, Original report 6 Sept 1993, adapted for Internet 8 Mar
2003
www.seafriends.org.nz/enviro/habitat/survey93.htm
In the spring of 1992, very dense plankton
blooms reduced the light reaching the kelp forest, such that the
entire forest died inside the Goat Island marine reserve and elsewhere.
This research was undertaken from private funds, assisted by a grant from
the Ministry of Fisheries (then MAF), to discover the extent of the kelpbed
death. At the same time, other observations were made. This document is
the result of this investigation, adapted for the Internet.
CONTENTS (with links on this
page). Use your back button to return to this
contents index.
Introduction This research was undertaken purely out of interest for the sea. The
author makes between 100 and 250 dives a year, most of which on the North
Island's East coast.
Between
October 1992 and December 1992 we have seen plankton blooms as never before
in the area around Leigh. Not many divers would have dived in those months
but we needed to set up the SEAFRIENDS saltwater aquariums and made many
dives to collect specimens. In November 1992 the blooms were so dense that
the amount of light at 20m depth was barely enough to distinguish between
the white sandy bottom and the dark, kelp covered, rock; even after 30
minutes of adjustment. In addition the water stayed unusually cool for
the year. Having had experience in transplanting seaweeds to our aquariums
and being familiar with the light levels they require, it was feared that
major damage would result to under water plants and for that reason to
the whole underwater community.
In the first week of January, cyclone Oli sheared the tops off most
of the kelp plants, which had died weeks earlier with their fronds resembling
soaked kraft paper. Almost literally the kelp forest disappeared overnight.
No trace was found of the missing canopy. Although at that time the 100%
death boundary was around 14m, kelp plants kept dying during successive
months, pushing this boundary shallower towards the 10m.
Immediately in January we started our preliminary survey, the results
of which form part of this report. During this survey we also discovered
the disappearance of other species, ranging over all phyla from sponges
to fish. The fish disappearance was discovered in February 1992 but it
was reported to the diving fraternity in the Dive Log magazine of December/January
1993 [1].
After having reported our findings extensively to the Leigh Marine Laboratory,
we had to give up further investigations through lack of finance. Letters
to various research institutions did not engender either response or enthusiasm.
In June 1993, however, Maurice Miles from the North-Harbour Public Health
Office brought us in touch with the right people at MAF, which resulted
in a small grant of $1000 to pay for fuel, film and fills. We were then
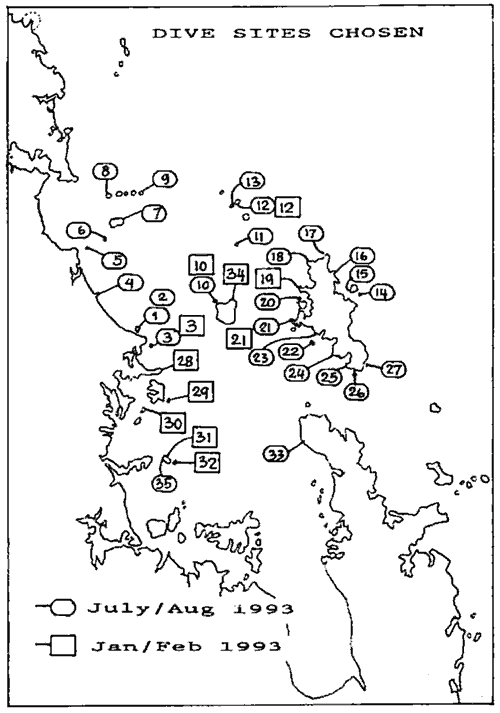
able to complete this survey. The above map shows all the survey sites.
Click on the map for an enlarged version.
I wish to thank Dr Bill Ballantine for his inspiring views over the
years that have contributed to this research. His help and proof reading
have improved this report considerably.
Looking back, this survey has taken:
55 exploratory dives, most of which were suitable for this report
970 nautical miles of boating
140 hours of diving and boating
80 hours of analysing and writing
In
this report we have brought together the data collected from 39 dives but
also observations and anecdotal evidence relating to the plankton blooms.
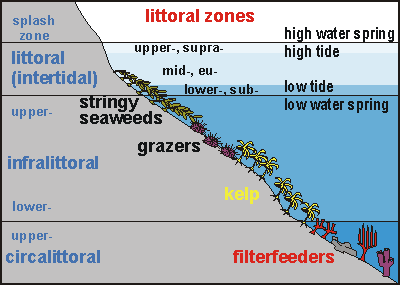
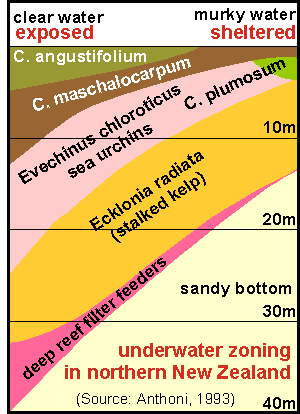
When reading this report, it is useful to know that the rocky shore in
this part of New Zealand is zoned, mainly because of wave exposure and
the availability of light:
The bladderweed or shallow weed zone contains hardy species such as Carpophyllum
angustifolium, C. maschalocarpum and C. plumosum; mentioned
in order of robustness. This is usually a shallow zone of only a few metres
wide.
Underneath follows a barren zone, usually grazed by sea urchins. Hence
it is also often called the urchin zone (Evechinus chloroticus)
or urchin barren.
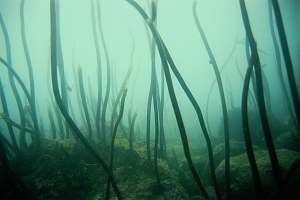
Then comes the kelpbed zone (Ecklonia radiata) which stops where
light becomes insufficient for it to grow.
Where the shore goes deep enough, the deep reef habitat is found with its
colourful sponges and other filterfeeders.
A personal note Let me share with you what an expedition like this felt like.My "research
vessel" is a 5m (17Ft) light aluminium runabout with a canvas canopy and
powered by a single 50hp Honda fourstroke outboard motor. It cannot really
be called a "vessel", hence its disrespectful name "seasquirt". But it
is amazingly seaworthy.With 120 litres fuel on board its action radius
extends to 100 nautical miles (almost 200km). It can just sleep 2 people
in its forward dry 'compartment'. A portable Bauer Junior compressor allows
one to refill dive tanks on board. After 5 days at sea, one runs out of
either fuel, drinking water, food or good weather.
After the 1993 kelpbed disaster and a preoccupied summer, there was
little time left before the stormy winter season.Because finding a suitable
buddy for such a strenuous endeavour at such short notice, proved in vain,
I decided to do it all alone. Mind you, I've made hundreds of dives and
travelled thousands of miles all by myself, which never bothered me. Being
"As free as a gull" suited me. And with 50 horsepower to back me, gulls
are definitely worse off.
My main problems were
About 60 cold water dives needing every calm spell before mid-winter,
The water was unusually cold.
About 1000 miles (nearly 2000Km) of boating in cold winds with some rains
(I often steered with a dive hood and dive mask on),
About 3 dives per day; 30 overnight stays.
Although I brought my movie camera with me on every dive, there was only
death and destruction to record, nevertheless interesting. These movies
have not yet been digitised for lack of money again.
At the end of the day towards 6PM I felt miserably cold, unable
to warm myself in my woollen pyjamas complete with woollen balaclava ,
until I discovered that a single shot of brandy restarted my circulation
and self-warming. (Who said that alcohol is a diver's enemy?) Dinner consisted
of a poached egg in seawater (you MUST try this, yum!) on baked beans
in tomato sauce and a slice of French bread with Colby cheese. Falling
asleep was never difficult in a gently bobbing boat anchered in a sheltered
spot among the noises of homing sea birds. Mosquitos remained a problem
though. Although the boat's canopy was precisely shaped to keep the blighters
out, NZ saltwater mozzies are fanatically determined. However, a can of
fly spray had the upper hand in this recurring war, leaving hundreds
of black bodies scattered around in the morning.
With hindsight, the academic community of paid-for biologists could
never have pulled this expedition off because of a number of reasons, primarily
because of their self- inflicted restrictions on "research-diving". For
instance, they won't allow themselves to go deeper than 18 metres (60 Ft)
where a diver is allowed to stay for one hour without the need of making
a decompression stop during ascent. Thus a significant part of the shore
is not being investigated. For my research, however, the lower boundary
of the kelp was important, for which I sometimes descended to the 'forbidden'
depth of 40m. See the diagrams of zoning.1, 2,
3.
Selecting the right sampling locations proved time-consuming because
they had to be representative of the area, facing the light and waves,
and easy to find and do again. Contrary to scientific mantra wich lets
the dice select the place (to exclude investigator bias), I knew that this
introduces unwanted 'noise' and rejected data. A quick 'scouting dive'
would tell me whether the place was right. Such pilot dives I make with
only a very small air tank ('pony tank'), good for only 10-15 minutes,
without buoyancy compensator. Not having the buoycomp's drag, allowed me
to swim fast, thereby covering a large area in a short time. And underwater
time was my hypothermia enemy. With hindsight again, these swift pilot
dives were massive time-savers overall.
Another massive timesaver was my earlier pilot study of only
a dozen sites to assess how to do the bigger survey. In scientific research
one must always do a "quick and dirty" preassessment before beginning a
time and money consuming final study.
Institutional scientist will no doubt snub their noses at this marine
survey, but the fact remains that they could not have done it themselves
on a thousand dollar budget, or perhaps even never. The coastal zoning
diagrams are indeed first in their kind, having been objectively measured.Also
the extent of the kelp die-back is new knowledge, perhaps never to
be repeated.
Now, twenty years later, I'm glad I had the foresight and energy/strength
(and some luck) to study the aftermath of a major ecological disturbance.
The findings in this report will for a very long time remain unique.
Floor Anthoni, March 2014
Chronology This chart lines up the events around the plankton blooms of 91/92
and 92/93.Note that "viz" means secchi disc visibility.
May 91
------
Nov 91
Dec 91
Jan 92
Feb 92
5 May: Whangarei heads, sponges abundant as usual.: Leigh 15m viz.
--------
Peasoup water around Leigh.viz 0.5-1.5m
Peasoup water around Leigh; Blue Penguins washed up
4 Jan:clear water 10m viz.17.6-18.2ºC; Cavallis: 15ºC at
10m; 12ºC at 30m (unusually cold)
19 Feb: discover loss of kelpbed at Little Barrier I; Temp 19.8ºC.
Viz 12m.
Mar 92
Apr 92
May 92
Jun 92
Jul 92
2 Mar: anemones still unaffected
15 Mar: discover disappearance of fish at Poor Knights
24 Mar: discover disappearance of fish at Mokohinaus
25 Mar: viz 4m
18 Apr: unusually large recruitment of Koheru, Demoiselle
28 Apr: last sighting of a big school of big Kahawai
7 May: sponges in the reserve still okay
30 May: another survey of Poor Knights. Fish still gone.
25 Jun: 14ºC. Viz 8m.
26 Jun: Viz 15m
Clear water
Sep 92
Oct 92
Nov 92
Dec 92
1 Sep: reasonable viz. Temp 12.5ºC
11 Sep: water suddenly very murky. Viz<3m
13 Sep: Viz 2-3m.Temp 13ºC (very cold)
30 Sep: Viz 4m. Temp 13.8ºC
Very dense plankton blooms
Very dense plankton blooms
Very dense plankton blooms. Kelp fronds dark brown and brittle
Jan 93
Feb 93
6 Jan: Tropical cyclone Oli removes entire kelp forest and causes shallow
kelp damage
9 Jan: Observed that kelpbed had disappeared
12 Jan: Viz drops back to 1-2m; Start preliminary survey; Discover
many sponges rotting
18 Jan: discover all Callyspongia dead or dying
25 Jan: No kelpbed damage found at the Poor Knights
1 Feb: Viz 10m. Discover late die-back of kelp
May 93
Jun 93
Jul 93
Aug 93
23 May: at North Reef Goat Island under 12m, all kelp had died; butterfish
had gone to shallow water
sponge garden had suffered from algal 'growth'; Discovered the school
of big Blue Maomao disappeared; Also the Demoiselles
27 Jun: Start of Marine Survey
Discover disappearance of Spotties in the Reserve
22 Aug: End of Marine Survey
Sep 93
Oct 93
Nov 93
This report is written
Diccon Morris, longliner reports that snapper can no longer be caught
inside the Hauraki Gulf.
They steam out 40 miles to catch them in 100-150m deep water. Fish
smudged with brown goo.
Blue penguin breeding failure: out of 12 nests, no chicks, 3 nests
with abandoned eggs..
Objectives By June 1993 it became clear that we were looking at major effects
affecting a very wide range of organisms: seaweeds, sponges, hydrozoa,
bryozoa, anemones, seasquirts, molluscs and fish. Also the plankton blooms
were estimated to extend over most of the northern Hauraki Gulf. There
was obviously not enough time to do accurate measurements, as the traces
of dead kelp were disappearing rapidly. It was decided to do many dives,
covering a vast geographical area but to measure quantities roughly in
terms like 'many' or 'few'. It was hoped that the many sites would cross-verify
one another geographically.
In this report all our observations have been brought together, in order
to stimulate thought and discussion.
Our main objective was to find the extent of the plankton blooms through
the kill it had caused to the deep seabed. Because plankton blooms occur
unexpectedly while developing and disappearing quickly, they are very hard
to quantify. Furthermore a very high number of expensive samples is needed
to measure both its intensity and expanse accurately. Fortunately however,
the damage caused can be used as a measure of the bloom's intensity.
Consider the blooms a 'photographic negative' that reduces the light.
The kelpbed damage would appear as a 'photographic print'. By measuring
the minimum depth of the kelp, the bloom's intensity could be measured.
The photographic print also left clear traces in the colour of the pink
paint, which covers most of our rocky shore. Palm-sized inprints of kelp
could be distinguished, separate from those left behind by sponges, anemones
and other sessile organisms. Also the pink paint is dark in colour where
it occurred underneath a covering kelp canopy.
We could even measure the 91/92 blooms which we had seen devastate
the kelpbeds around Little Barrier Island. These sites would be recognisable
by 1-1.5 year juvenile Ecklonia and perhaps the remnants of holdfasts,
and their prints.
The 'photographic print' could also give us an indication of how the
currents flush the Hauraki Gulf.
Another important objective was just to look around to see what's there
and to observe other phenomena. For instance, by looking at many sites,
it was hoped to obtain a better insight into how Ecklonia reacts
to light starvation. Overall, the exercise has given us a much better understanding
of the rocky shore ecology in this area. This report contains a number
of exciting and unique results, which have not been published before. It
also corrects some misunderstandings scientists have about the rocky shore
ecology and the cause and extent of kelpbed deaths. Contrary to traditional
scientific research with a before and an after situation, our research
became like detective work, relying on traces left behind by the past.
Criteria
and method
[criterion: Gk: kriterion= means of judging; principle
or standard that a thing is judged by]
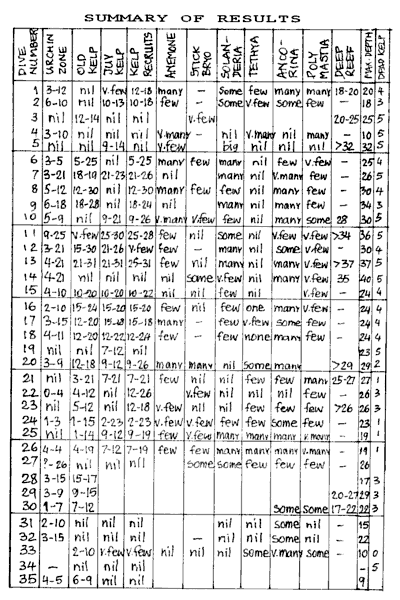
Why each criterion was chosen, will be discussed before its results
in the next chapter. The preliminary survey of January/February 93 had
shown that more things needed to be looked at than just kelp. Apart from
obvious physical factors such as temperature and visibility, we measured
accurately the depths of the various ecological zones. We also qualitatively
measured the species abundance for various sponges, hydrozoa, bryozoa,
anemones and fish.
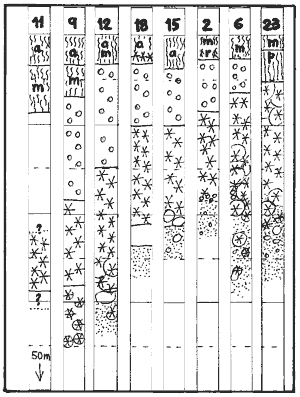
Immediately after each dive an extensive report was recorded on a tape
recorder, following a checklist of items to look at. The same day, the
dives were transcribed onto paper with as much detail as possible, including
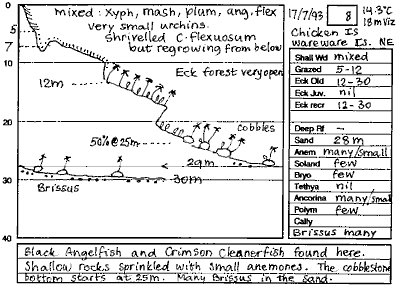
a sketch of the shape of the transect. The picture shows the results of
a typical transect drawn on preprinted waterproof paper. For this report
the salient information was extracted and tabled, as shown in the appendix.
Problems encountered Ideally, a survey site should have the following properties:
a north facing slope, to maximise the effect of light on the environment
a gently sloping shore, to be able to measure boundaries accurately
a deep bottom, to be able to measure the kelp's lower boundary
have medium exposure, so that a set of comparable transects can be collected
but these places are rare or impossible to find, because of environmental
variability and conflicting criteria. We studied three-dimensional depth
sounder images carefully for each proposed site, and often had to relocate
because of unexpected circumstances.
Environmental variability The seascape changes very rapidly in response to wave exposure. Measuring
two sites, only 50m apart, can give very different results. For this reason
we were interested in the relationship between biological zoning and exposure.
Dive sites have to be chosen with much care in order to minimise unwanted
variation and to maximise meaningful information. For instance, an exposed
rockface would have an enormous barren zone which yields very little information
and it would lack overhangs, cracks and caves which sustain a rich variety
of life. By choosing sampling sites strictly at random, it is very likely
that the studied effect will be drowned in unwanted side effects. When
setting out a transect, it is often better to sample over a wider area
in order to record what is typical rather than what the transect line actually
yields.
Conflicting criteria For optimal kelp growth, a north facing slope is wanted but very often
these slopes are also very exposed. For studying sponges, a site with a
deep reef habitat is required but it must also be sheltered. But wherever
shelter is found, the bottom is shallow too, leaving no room for a deep
reef habitat. Places with deep bottoms are also often very steep, thereby
shading out the sunlight for part of the day and making life difficult
for sea urchins. Places with drop-offs, cracks and gullies invite a richer
diversity of life but they also form barriers to sea urchins, changing
their 'natural' range. Several dives had to be aborted because the chosen
spot proved to be unsuitable. In practice we spent much time studying (three-dimensional)
depth sounder recordings before deciding where to dive.
Measuring what is missing It is scientifically impossible to measure what is missing unless a
baseline from a previous study is available. For this reason alone, inaccurate
measurements through quantifications like 'few' and 'many' are sufficient.
As the results show, they were indeed entirely adequate for the purpose.
Babcock [2] uses ratios of dead over living things to measure the kelp
deaths. But this method is useful only immediately after a disastrous event
and only if a small proportion died. For instance where stipes and holdfasts
have disappeared altogether, the obtained measure would be incorrect. It
would also be inappropriate where no living things remain, or no traces.
But this is exactly what happened to the kelp forest.
The influence of time This research spans a period of 8 months, during which nature has not
been idle. The kelp didn't die as if run over by a grassmower; an instantaneous
event. But it died back gradually after the initial sudden 'early' deaths.
For that reason, all of the January dives needed to be redone, which wasn't
altogether possible. For instance, dives 28-32 have not been duplicated.
It was hoped that the remnants of Ecklonia holdfasts could still
be found on the rocks as proof that the old forest had once been there,
but alas after 7 months, most traces of early kelp death had been erased.
Babcock [2] has measured how long it takes for all traces to rot away (about
6 months). Fortunately, however, their 'photographic imprints' remained.
In the meantime the environment started to recover. Kelp recruits were
found where once the kelp forest stood. But this opened the opportunity
to single out those places with poor recruitment and to use the presence
of kelp recruits as an indication of where the old forest once had been.
Results and discussion
Water
temperature Lower than normal water temperatures are thought to have contributed
to the blooms. Although our survey happened at a time of extremely good
underwater visibility, the direct opposite of a plankton bloom, we were
interested in how temperatures changed geographically. The Leigh Laboratory
measures sea temperature on a daily basis, which has provided an excellent
record over time but spatial temperature variation data has been collected
much less frequently. Surface temperatures could reveal how the water in
the Hauraki Gulf mixes and how it is flushed with ocean water. [This can
now be done from satellite data]
Water temperature was measured with the boat's digital thermometer,
which measures surface temperature only. It is accurate to 0.1 degree C
and has a high degree of consistency, although it may not be accurate in
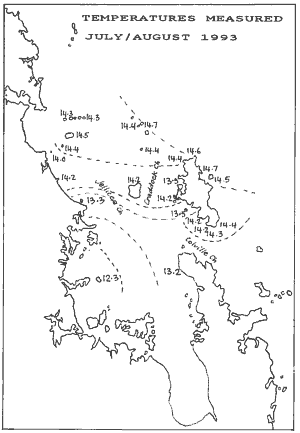
absolute terms. The map shows the seawater temperatures, with isotherms
drawn for every half degree C. The data suggests that a slow ingress happens
from the north, mainly through the Craddock Channel. From [4] it is known
that tidal currents in the Colville Channel are very strong. Our data suggests
that tidal water flows around the southern tip of Great Barrier whereas
the murky and colder waters of the inner Hauraki Gulf flow around Coromandel
Peninsula through the southern part of the Colville Channel.
It must be noted here that this set of temperatures is but a snapshot
of the complicated way temperatures move in space and time. For instance,
in winter the gulf water is colder than the ocean but in summer it is warmer.
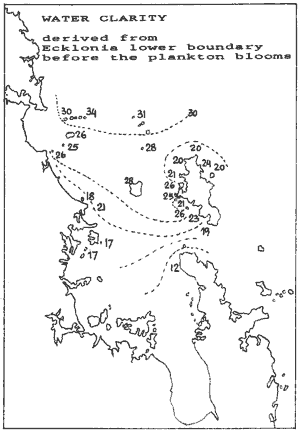
Water
clarity The lower boundary of the kelp forest is caused by lack of light. The
kelp bed thins out and the deep reef habitat, dominated by sponges, begins.
Along this boundary, the kelp plants can just survive and recruitment is
possibly marginal too. Where the water is clear, this boundary is deep,
whereas it is shallow in murky waters. Since kelp plants live for about
a decade, the depth of the kelp's lower boundary is related to the average
clarity of the water over the life of the kelp. Sites 31,32,35 of the inner
Hauraki Gulf had to be excluded because of meaningless data. For site 33
an estimate was made, knowing that 50% mortality happened at 10m. It must
be noted here that it was the worst time to do these measurements because
the whole kelp bed, including its lower boundary had been thoroughly upset.
The results, plotted here, suggest an ingress of clear water through
the Craddock Ch. A rather sharp boundary exists between the Chickens Is
and the Hen Is, and also between Simpson's Rock and Great Barrier. The
water around the north of Great Barrier is unexpectedly murky. This observation
also correlates with the extents of the plankton blooms. It suggests that
this area suffers plankton blooms quite regularly.
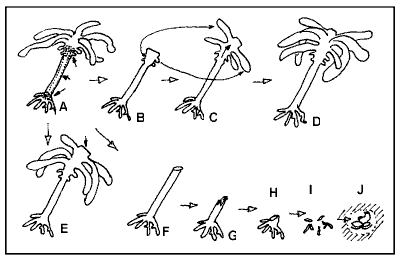
Kelpbed damage This
survey gave us a better understanding of how Ecklonia reacts to light starvation.
The diagram shows the story pictorially.
(A) shows a healthy plant with its main areas of growth: the crown that
sprouts the fronds, the stipe that grows thicker and the base that sprouts
the holdfast. The crown grows out from a growth centre, the merristem,
located just above the stipe. When Ecklonia is eaten short (B), as was
observed at the Rainbow Warrior, it will regrow completely within a year.
But what was observed was a successive loss of fronds, then the entire
crown including the crown's growth centre (F). This was followed by rapid
decay of the stipe (F and G) and ultimately the holdfast (H and I). The
last traces that may remain are a cluster of brachiopods and small seasquirts.
Eventually only a lighter spot on the pink 'paint' crustose coralline alga
(Lithothamnion sp) may be all that is left.
In a borderline case, of which we found only one site (21), the
whole crown jaundiced, looking golden yellow in the process. Then new dark
fronds formed in the same time as the jaundiced crown decayed, which happened
in about 7 months. Since this happened only in one place, it must
be considered uncommon.
Assessing the damage was very simple. A simple scan of the area quickly
showed how much of the canopy was still left. The top boundary could easily
be established from either the presence of sea urchins or from the lighter
colour of the pink 'paint'. (In the darkness underneath the kelp, the pink
'paint' takes on a deeper pink, almost purple colour). The lower boundary
was also easy to find. It was as deep as recruitment could be found, and
old marks of kelp holdfasts. In the transect data the density of the kelp
canopy is drawn to scale.
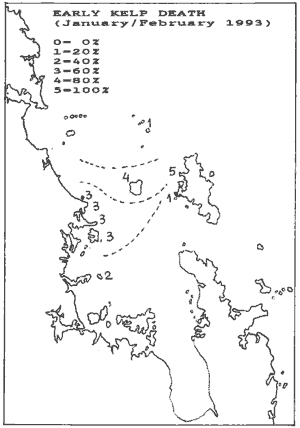
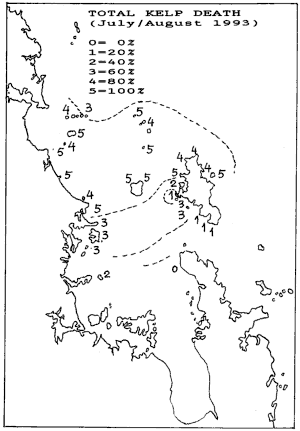
The results have been plotted below for early kelp death and
late kelp death. As can be seen, the two correlate. It shows that initially
a narrow band between Mangawhai and The Needles caused a short sharp death.
But later this band widened to cause late death over a considerably larger
area. Note how this area curves around the top of Great Barrier, suggesting
that during the blooms, clean water flushed in from the south while pushing
the plankton bloom over the top of Great Barrier. But most importantly
perhaps, that during an El Niño season, the flushing of the Hauraki
Gulf may stagnate.
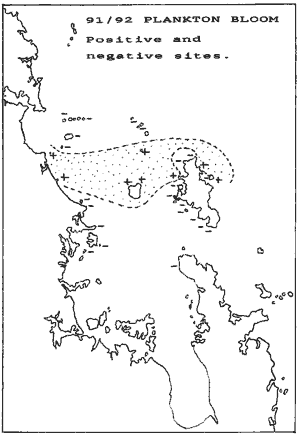
The 91/92 blooms It was possible to assess the magnitude of the 91/92 blooms in the
following way: If the 91/92 blooms caused substantial death of the kelp
bed, then the recruitment afterwards would now exist exclusively of 1 to
1.5 year juveniles, which are easily distinguishable from other year classes.
Juvenile Ecklonia can easily be distinguished from the mature plants
by its much smaller size and thinner stipe. It also looks very clean and
fresh. So places with very little old kelp but a lot of juveniles were
almost certainly hit by plankton blooms in 91/92. We had seen it occur
at Little Barrier and could test our case there.
In this map we plotted the sites that were definitely positive and
those that were definitely negative. Again, a band results that looks remarkably
like a smaller version of the 92/93 blooms in the maps above. It also shows
that the 1991/92 kelp death largely remained unnoticed, since the places
where it occurred, are not frequently dived on.
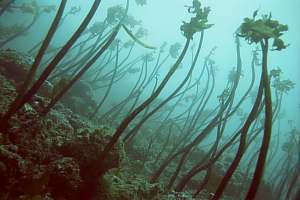
f016803: Total kelpbed death in the Goat Island marine reserve.
f017717: this vista is typical of late kelpbed death. Although
the sunlight has been restored, the old kelp still keeps dying, which may
take 6-9 months.
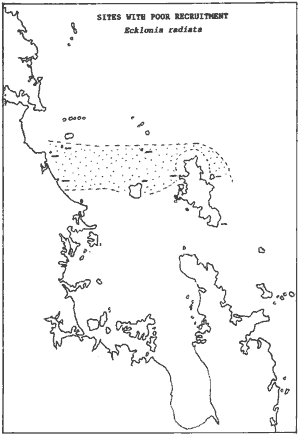
Poor recruitment Considering the complicated dual phase reproductive cycle of Ecklonia
radiata, its quick recruitment leads one to think that 'spore banks'
are present under the old canopy. What these 'spores' are doesn't really
matter, but central to the idea is the concept that such spore banks, once
activated (perhaps by light), cannot be activated again. Thus a second
knock-back should result in subsequent poorer recruitment. We could test
this hypothesis by plotting those sites that had a very much poorer recruitment
in 1993/94. The map above shows that these sites concur with the 91/92
blooms shown next to it. Thus support was found for the 'spore bank' hypothesis.
Species decline A decline or loss or damage can be shown if:
the damage is still visible
the site has been visited previously and was known to have more of the
species concerned
the site is so typical of a general pattern that assumptions of usual abundance
can be made.
Each species was judged against these three criteria on each site surveyed.
Although a quantitative judgment was made on the various species chosen
for this research, the data proved to be very difficult to interpret. This
should come as no surprise because superimposed on the effects we wished
to study were the normal geographic distribution and the species' sensitivity
to exposure.
As an example survey17.gif below,
plots the abundance of solanderia, the hydroid tree. And although the data
is geographically consistent, it could also be interpreted as solanderia
favouring clear water in wave-exposed places, which is characteristic of
this species.
Anemones The common white anemone (Actinothoe albocincta) was chosen
because it is common and rather sturdy. Although it has been knocked back
it was found to be still common. It has been found to explode through recruitment
of vast numbers of small anemones in all the sites that have been hit by
the plankton blooms twice.
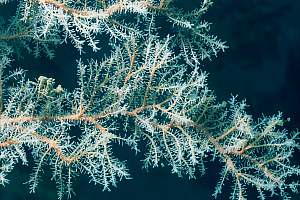
Solanderia The hydroid tree (Solanderia sp) has become uncommon. The few
'shrubs' still alive, look scruffy with much 'deadwood'. Only outside the
Hauraki Gulf do they still occur in their former abundance.The stippled
area in the map connects sites with unusually low occurrences. These appear
to correspond to the 1991/92 and 1993/94 plankton blooms.
Bryozoa Bryozoa have become rare. Although we looked for the stick bryozoa
(Steginoporella sp.), we also made notes of other kinds of bryozoa.
In the whole area we dived in, this phylum has been reduced in numbers
considerably. Rock walls which, from vivid memory used to be carpeted in
stick bryozoa, now stand denuded and dirty. It must be noted here that
the stick bryozoa is sensitive to dust and that a gradual decline in the
Leigh area has been seen, most likely from deposition.
Tethya sponges The orange (Tethya aurantium) and pink (T. ingalli) Tethya
sponges used to be common in the reserve and around Leigh. Then they suddenly
disappeared, after the blooms (Feb/Mar 93). In none of the studied sites
were they found in numbers anywhere near what they used to be. But towards
the southern tip of Great Barrier, they became more numerous (sites 24-26).
They are also still common and healthy at Te Arai Point (site 4), where
sand blasting is suspected to keep them clean.
f033513: closeup of a healty solanderia hydroid tree.
Notice its tiny polyps which it is unable to retract.
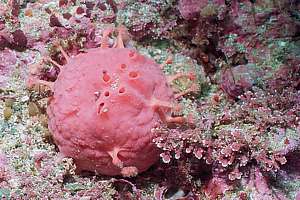
f033724: a pink golfball sponge (Tethya ingalli) in
the process of multiplying asexually. At the end of 'tentacles',
it grows miniature sponges, which it then separates off.
Ancorina sponges The big black Ancorina sponge (Ancorina alata) was chosen
because it was so common in most habitats. It occurs from as little as
a few metres below the surface all the way down to the deep reef. After
January we had seen it die and rot away at an alarming rate, e.g. one in
every 30 was rotting away. However, this study revealed that, although
their numbers and sizes have been affected, Ancorina fared reasonably
well.
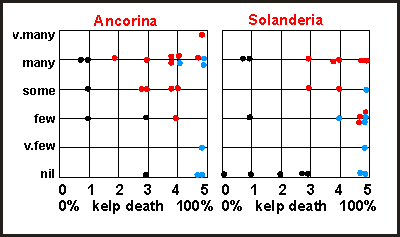
The
effect of the plankton blooms on both Ancorina and Solanderia
was not clear-cut. The cluster diagram shows the abundance of both plotted
against the severity of the plankton bloom, as measured by the amount of
kelp death. The black dots are the places around the Colville Channel that
are affected by sedimentation (mud) and some current, whereas the blue
dots are where the kelpbed died twice. The graph appears to infer that
Ancorina
is a robust survivor, but dies when stressed by both mud and overly dense
plankton.
The Solanderia cluster diagram shows the Colville Channel cluster
as distinctly separate, suggesting that Solanderia dies from mud but survives
where currents are strong (top two black dots). The blue dots in this cluster
suggest that the plankton blooms had a notable effect. The sites with many
Solanderia
were all located near currents. Where the plankton blooms happened twice,
fewer Solanderia were encountered than where it happened only once.
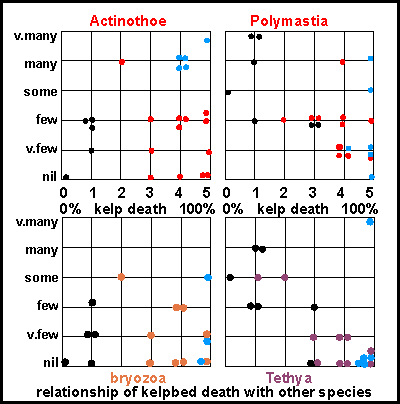
Polymastia The yellow Polymastia sponge was chosen because it is common
and tolerates sand. Like Ancorina it is normally found at a wide
range of depths. It used to be common before March 1993 but its numbers
have been decimated everywhere. Although some of the sites studied do not
provide typical Polymastia 'territory', the overall picture looks
pretty grim. However, again sites 4,25,26 looked 'normal'. In other places
many very small Polymastia have been seen.
These
cluster diagrams depict possible effects of the dense plankton blooms
on other species. On left 0% kelp mortality and on right 100%. For the
white anemone (Actinothoe) the situation looks confusing until the
cluster coloured in blue at the top left is isolated, because these belong
to the sites that lost their kelpbed the year before, followed by population
explosions of these anemones. The yellow Polymastia sponge shows
a similar sensitivity but Tethya sponges appear to be more sensitive.
However, the situation with the bryozoa is not at all clear, whereas observations
have shown them to be quite sensitive to land-based pollution. Locations
bordering the Colville Channel (black dots) appear to have lost their bryozoa
before the event, whereas Arid Island (top left) retained some of its previously
very many bryozoa.
It is surprising that the dose sufficient to kill the kelp, was also
enough to kill all Tethya sponges. The pink Tethya ingalli
appeared more sensitive than Tethya aurantium, and would be a good
indicator species.
Reader please note that the above cluster diagrams were
inserted in July 2003 after completing the Plankton
Balance hypothesis. I then realised that data not previously analysed
could support it. The cluster diagrams indeed provide support if the organisms
died because of the same dense plankton blooms that killed the kelp, which
cannot be proved. However, maximum kill occurred in the cleanest of waters,
making it more probable. It is pleasing that the results did not
disprove the hypothesis (after dense plankton blooms filter feeders are
still healthy). Note that the kelp died from lack of light, whereas these
filter feeders who thrive in darkness, died from other causes.
Callyspongia The purple fingersponge (Callyspongia ramosa) lives along steep
cliff faces and around the lower kelp boundary where it forms big fans
of curved fingers. It likes currents and dislikes dust. It died very early
on. Around Leigh we could not find a single live one. Chris Battershill
investigated this further [personal communication] and confirmed our findings.
He also mentioned that this had happened before, in the 81/82/83 El Niño
season. Site 9 (East of the Chicken Islands) was the only place where five
very small individuals were found.
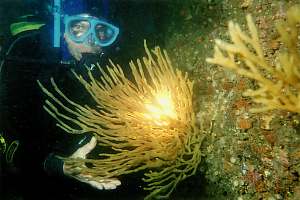
The author posing by a deceased Callyspongia When touched, this sponge fell apart like soaked parchment.
at Floors Reef, Goat Island, 18 January 1993
Yellow boring sponge The yellow boring sponge (Cliona celata) has also disappeared
almost completely. Those patches still found were only barely alive.
Compound ascidians Encrusting compound ascidians, the orange and pink blobs and pads found
almost everywhere, have also disappeared from all sites visited. (Botryllus
sp and Clavelina sp). We have excluded it from our data summaries
because it was nowhere to be found. Compound ascidians are thought to be
fast growing and quick to re-establish. They were amongst the first organisms
to colonise the Rainbow Warrior.
Fish In an article for Dive Log (Appendix 9.3) we alerted the diving community
to what we thought was a massive disappearance of pelagic and many reef
fishes. All the dives done for this survey furthermore support those findings.
In the meantime the common spottie (Pseudolabrus celidotus) must
be added to the list (see also Appendix). The
fishes least affected are red moki (Cheilodactylus spectabilis)
and goatfish (Upeneichthys lineatus). But it has been observed that
the entire cohort of 91/92 disappeared in Feb/Mar93. The recruitment
of 92/93 is smaller than usual.
Crayfish Crayfish has become one of the rarest organisms in the Gulf. Very few
were encountered. We found more boat anchors than crayfish and also more
of the rare giant boarfish! Compared to the densities in the Leigh Marine
Reserve, it would have been 0 to 2 percent. Whenever a craypot was encountered
near the survey site, its content was inspected and the area up to 40m
around, searched for crayfish. In all 6 cases where the craypot contained
crayfish, no crayfish could be found in the surrounding area. It suggests
that craypots are able to attract crayfish from further away but most important
of all, that the days of crayfishing in the Hauraki Gulf may be numbered.
But we found increasing numbers of young crayfish from Tryphena (Great
Barrier Island) going south.
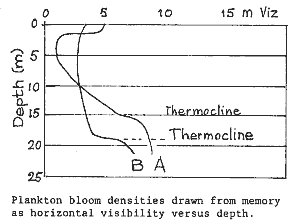
Other observations Plankton
bloom densities Because we were diving actively during the plankton blooms (Sep 92
to Dec 92), it pays perhaps to include some anecdotal evidence. The blooms
would often concentrate 1-2 metres below the surface, thinning out as one
went deeper. In the figure, observed underwater visibilities have been
plotted. Curve A was for the early blooms from October 92 to November 92.
Curve B shows how in December the bloom mixed into all depths. But even
then clear water could often be had underneath the thermocline at 18m.
When the blooms were at their height, it would be as dark as a moonless
night at 20m, despite bright sunlight at the surface. Another observation
was that now and then a patch of clear water came in with visibility about
twice what was common at the time.
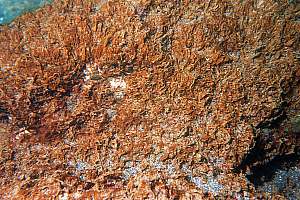
Brown slime, brown fluff After the blooms the rocks were covered with a sticky kind of 'dust'
that was difficult to remove. It was oserved that sponges covered by it,
died. The 'dust' grew into a kind of 'brown fluff' that covered just about
everything. Particularly affected is the deep reef habitat. Our survey
has shown that the deep reef habitat is rare inside the Hauraki Gulf. Even
outside the Gulf it is often difficult to find deep rocky shores that are
not too much exposed. Where suitable places were found, we descended to
well over 40m to observe the deep reef habitat. In all cases we found major
damage to this habitat. Everything was covered in brown fluff (Ostreopsis
sp.) that was hard to remove. It is estimated that over 80% died.
Already during our exploratory survey of Jan 93, sponges were seen rotting
at the rate of 1 in 30. Similar events in our aquariums, showed that
a sponge such as Polymastia could disappear in one week. The sponge
rot has been observed for 3 consecutive months, occurring at approximately
the same rate. It suggests that close to 40% could have disappeared in
this manner.
f030305: brown fluff hangs on tenaciously to what once
was pink turf. All grazers were killed by it. This brown slime was later
identified as a dinoflagellate Ostreopsis sp..
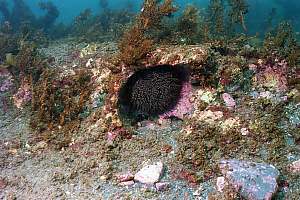
f030234: a sea urchin living safely within its 'socket',
carefully ground out of the surrounding rock by many generations of its
kind. The surroundings are covered in poisonous brown fluff, and the rock
is poorly grazed due to its jagged shape.
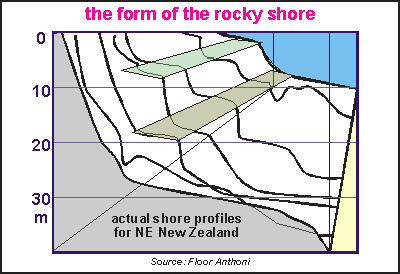
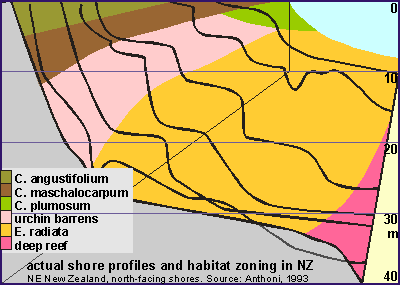
Zoning
in relation to exposure. Unlike the landscape above water, the seascape changes very drastically
with wave exposure, because exposure from waves has such an enormous range,
and is influenced remarkably by changes in topography (shape of the shore).
In order to find suitable dive sites for a possible follow-up, perhaps
serving for base line studies, we wanted to know the effect of exposure
on habitat zoning. In order to 'sort' the shore profiles by wave exposure,
we made the rough assumption that the depth of the sandy bottom is related
to wave exposure (See Harris [6]). But we had to be careful in selecting
representative sites. The strip diagram below shows the result, and the
colourful diagram on right its final version. Sites were disqualified for
one of the following reasons:
Pinnacles, which distort the depth of the sandy bottom.
Sites with strong currents, which distort the depth of the sandy bottom
Sites with gullies, cracks and steep drop-offs, which hinder urchin grazing
Sites without sea urchins, these are considered a special case. See below.
Sites with excessive kelp damage, where boundaries were indeterminable
The remaining sites show remarkable continuity from which the exposure
chart was drawn. This chart invites some comments.
The shallow bladderkelp zone widens with exposure.
Where C.angustifolium and C. maschalocarpum are found, C.
angustifolium occurs always above C. maschalocarpum.
C. plumosum is found only on very sheltered sites where it is usually
found under C. maschalocarpum.
The urchin band widens with exposure and goes deeper. The top of the urchin
band is perhaps caused by the maximum wave exposure urchins can tolerate.The
lower boundary is due to a mix of other factors, like: a) wave damage to
kelp; b) urchins felling the kelp 'trees'; c) a reduction of algal food
on the bare rock, due to reduced light; d) the kelp's inability to recruit
and to re-colonise the urchin zone.
The lower boundary of the kelp forest, here bounded by the sand, is otherwise
bounded by lack of sunlight. At the Poor Knights where the water
is clear, the kelp forest is found to about 35m but inside the Hauraki
Gulf this could be less than 15m. In murky waters, the place of the kelp
is taken by the flexible bladderweed C. flexuosum.
Underneath the kelp's natural lower boundary, starts the deep reef habitat
with its many sessile filterfeeders such as sponges, hydroids, bryozoa
and seasquirts. Inside the inner Hauraki Gulf, this habitat is severely
degraded by sediment.
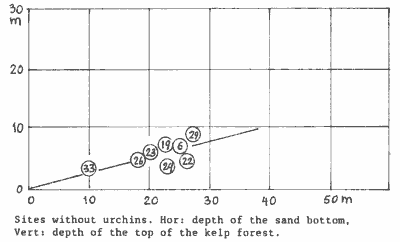
Barren
zones without urchins We found 8 sites with barren zones but no urchins. Grazing was done
by the Cook's Turban snail (Cookia sulcata), occasionally assisted
by Paua (Haliotis iris). Because we were interested in the natural
upper boundary of Ecklonia, caused by wave exposure alone, we plotted
these sites against sand bottom depth, which is assumed here to correlate
with exposure (as it does in the exposure-zoning chart). Sites 24 and 22
are positioned too far right because they are located in strong currents
of the colville Channel. Note that the boundary is caused by the last big
storm event, and that a successively larger event may shift it further
downward (steeper curve).
This diagram suggests that there exists a positive relationship between
the upper kelp boundary and the sand bottom (wave exposure). Without urchins,
the kelp forest starts about one quarter from the surface. Although more
work is needed before binding conclusions can be drawn, we plotted this
curve in the habitat-exposure diagram (dash-dot line). It suggests that
the influence of grazing on the kelp's natural upper boundary is quite
important. Where this line intersects with the bladderkelp zone, it explains
that kelp can be found directly underneath this zone, only on very exposed
and very sheltered places. This has often been observed (See sites 2,10,13,18,21).
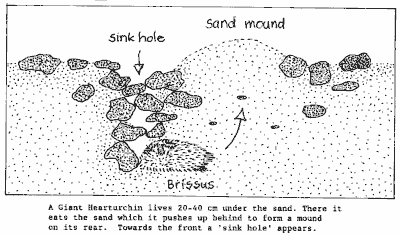
Giant
heart urchins The giant heart urchin (Brissus gigas) was discovered because
of plankton blooms. In 82/83 the excessive plankton blooms rained down
and formed a sticky, thready mass on the bottom. Under 15m depth many organisms
died, including scallops, sea urchins, sponges, seasquirts and demoiselles.
During a dive at Leigh Reef, many giant heart urchin tests were found on
the sand. These were bagged and studied. Up to that time, little was known
of this species. (See also NZ Herald article
of 19 Feb 1983)
The diagram shows how a giant heart urchin burrows in course shelly
sand. As it removes the sand in front, while pushing it up behind, a sink
hole appears and a mound of sand behind. The sea urchin consumes the sand
grains whole, and digests whatever lives in between. The sink hole collects
detritus from the bottom's surface, and this is perhaps the main ingredient
of the urchin's diet.
In
1983 also a dying specimen was found by Chris Battershill, near Leigh.
Although discoloured already, it showed what the live animal looked like.
In 1989, after studying the common heart urchin (Echinocardium australe),
we linked 'sink holes' found in the sand to the giant heart urchin. It
lives 20-40cm below the sand surface, rather than 3-5cm for the common
heart urchin (Echinocardium australe), and has therefore escaped
the attention of scientists. Digging a hole that deep (in order to catch
it), is rather cumbersome underwater because of the dust it causes and
because the hole keeps caving in. At the end one has to dislodge a large,
very prickly object, without damaging it. It was shown that the giant heart
urchin lived in their thousands right under the watchful eye of the scientific
community of the Leigh Laboratory! What is more, their diggings are rather
obtrusive and often half a metre across, and nobody had wondered what they
were!
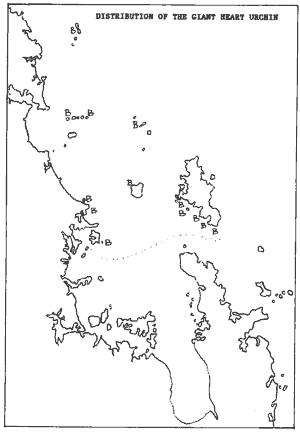
From that point in time, giant heart urchins could be sampled without
disturbing them. In this survey, the sites with these big urchins were
marked "B". The map shows that they are common in the northern part of
the Hauraki Gulf and further north (including the Three Kings Islands).
It also suggests that they are unlikely to be found inside estuaries, as
their boundary stops half-way the Hauraki Gulf. It must be noted here that
giant heart urchins may also be found in wave-exposed sandy areas but here
their diggings are erased easily by successive storms, and they cannot
be sampled easily. However, my impression is that these heart urchins prefer
clear water and coarse, shelly sand.
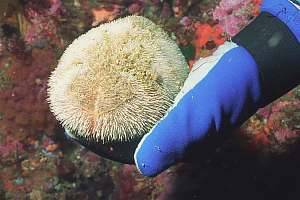
f032814: a small giant heart urchin (Brissus gigas)
was recovered from beneath the sand. Notice its short, combed-back
spines.
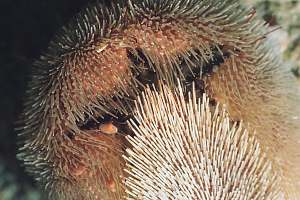
f032809: in a closeup of the animal's mouth area, one can
see details of the various types of spine, each assigned a different function.
One can also see the tiny commensal bivalves, which are able to move swiftly
through the forest of spines.
Blue
penguins In December 1992 a mass stranding of blue penguins (Eudyptula minor,
fairy penguin) was observed, but such strandings are not uncommon. When
boating from Leigh to Little Barrier and back, in slight seas, usually
a dozen or more penguins are seen in a very narrow swath/transect of about
100m wide. But for some time now, only a few (3-4) were seen each time.
It was decided to include blue penguins in our survey. However, the only
way to count them properly is during very smooth, glassy seas. Then they
can clearly be distuinguished from other sea birds up to 50m around. The
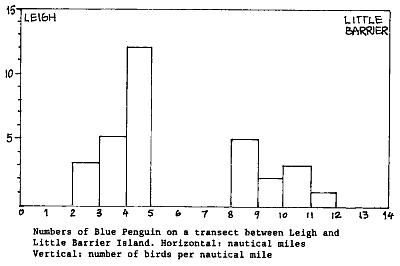
diagram below gives a transect made under such conditions, between Leigh
and Little Barrier island. The histogram suggests that blue penguins like
to feed between 2 and 5 nautical miles offshore. A total of 31 birds were
counted over a swath of 100m wide, which equals to about 3 birds over a
swath of 10m wide - consistent with our initial observations. It is feared
that Blue Penguins have been reduced by 60 - 70 %.
[Note, this transect was repeated in February and June 2003, under
similar conditions. Only 2 birds were seen!]
Concentrations
of blue penguin were also found south of the Chicken Islands and in front
of Omaha Bay. In 2003, we found another concentration between Kawau Island
and Martins Bay (Feb 2003). We had the opportunity to re-do the penguin
transect between Little Barrier and Leigh, in February 2003, and found
only 3 penguins over a swath of 100 metres wide. No penguins were found
close to Little Barrier Island. It suggests that their numbers have declined
further in the decade since.
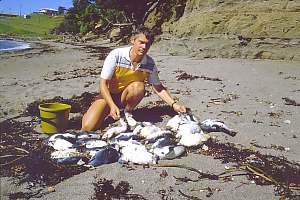
Mass mortality of dead blue penguins on Goat Island beach.
Most of the birds had already been buried by visitors.
f015332: a fledgling baby blue penguin of the white-flippered
variety is an endearing creature to see, but it does not have the attributes
that make for a good pet. At the best of times, the sea is a hard environment
for them to survive in, but humans have made this much worse, as our surveys
suggest.
Subtidal
platforms This research was based on the assumption, that with some care, the
depth of the sand can be thought of as a measure of wave action. Results
using this assumption, have proved to be consistent. The method allowed
us to 'sort' profiles in a meaningful way, as those shown in the diagram.
To our surprise, three platforms appeared below the intertidal platform
which falls dry at low tide. It suggests that platforms occur on the boundaries
of the major zoned habitats. More, and more careful work needs to be done
to substantiate this.
The intertidal platforms (not shown here) are surprising, because it
is exactly where they occur, that wave action is highest. Yet the 'dry'
coast above it, appears to erode faster. A valid explanation for this is
that where the rock is wetted by sea water, a community of living organisms,
covers all parts of the rock, thus cushioning the abrasive work of waves.
Damage gets repaired, resulting in a very slow overall erosion. The pink
paint (Lithothamnion sp.) is a champion in this process, since it
is so hardy, while occurring from above high tide to over 70m deep.
Pink paint covers rocks so thoroughly, that we have observed steel anchors
and chains not rusting underneath. It may well be that this stoneweed prevents
oxygen and acids from reaching the rock, thereby slowing down its natural
rate of weathering.
Why pink paint would slow down erosion on the boundaries of the urchin
barrens, we fail to explain. Remember that the above subtidal contours
may have taken a millennium to form. To find a continuum of platforms surrounding
the urchin barrens, suggests that such barrens have been there long before
the arrival of mankind in New Zealand. It may well be possible to carbon-date
the underlayers of the pink paint, in order to arrive at new insights.
Conclusions and discussion This survey has shown that following the severe algal blooms of 91/92
and 92/93, the underwater environment has suffered considerably. A wide
range
of organisms was implied. Had this survey not been done, the loss of many
common organisms might not have been detected. We are also perfectly aware
that many organisms may have escaped our attention (note the late discovery
of the loss of spotties). There is no simple explanation for the damage
caused. It must probably be found in a complex combination of low temperatures,
photo starvation, kelp leachates, plankton toxicity,
ostreopsis
and sedimentation.
Because gradients in our data are unusually steep towards Whangarei,
the influence of the Whangarei Harbour and its industries (cement, glass,
oil refining) must not be ruled out. These industries may provide the nutrients
most needed by the plankton community.
The Hauraki Gulf Marine Survey 1993 has provided a set of data that
is geographically consistent and that was adequate to answer a number of
pressing and interesting questions. However, it has also raised new questions
that require a more solid scientific approach including more sampling points,
while quantifying them more precisely. The study has shown that New Zealand
needs a network of sampling sites in order to quantify what is happening
to our seas. It won't be easy to choose the best and least number of sites.
But the experience gained from this survey could be used to advantage.
The processes that occurred during the blooms were all very sudden and
amazing. Likewise the road to recovery will be unexpected. If we are to
learn from the biological oscillations that are bound to follow, we need
to have a policy for monitoring the recovery process. This survey could
serve as the 'base line' for the recovery process. We also need to look
at long-living organisms that may store a record of year-to-year progress,
like growth rings. Such growth rings would give us an idea of how the organisms
'rated' their living conditions for each year. Some shellfish and corals
would be suitable and perhaps the most amazing and hardy organism of all,
the pink 'paint' (Lithothamnion sp.).
[2] Babcock, R C and R G Cole. "The extent of die-back of the kelp Ecklonia
radiata in the Cape Rodney to Okakari Pt Marine Reserve". Advice to the
Department of Conservation. June 1993. Leigh Marine Laboratory.
[3] Ballantine, W J. "The algal bloom and climate anomalies of 1992".
Leigh Laboratory seminar. May 28th, 1993.
[4] Greig, M J and Proctor, R. 1988."A numerical model of the Hauraki
Gulf, New Zealand". NZ Jnl of Marine and Freshwater Research. 22.391--400.
1988.
[5] Harris, T F W. "North Cape to East Cape".University of Auckland.
Leigh Marine Laboratory Bulletin 28. 1985.
[6] Harris, T F W. "Hauraki gulf tideways. Elements of their natural
sciences". University of Auckland. Leigh Laboratory Bulletin No 29. 1993.
[7] Visit our large chapter about decay
in our seas and its probable cause..
Appendices
OBSERVATIONS ON THE DECLINE OF SPOTTIES
IN MAHURANGI HARBOUR
On 14 March 1993, Mrs Margareth Jarius from Snells Beach, related the
following observations to me:
Margareth is a keen fishing lady and fishes regularly on several places
along the Mahurangi estuary. She has noticed a considerable reduction in
the numbers of spotties caught as a by-catch while line-fishing for snapper.
The inner Mahurangi, Scotts Landing and Mullet Point are places where she
fishes regularly. Previous to 2 years ago, the spotties were a nuisance
because in an hour's fishing, one would catch 3-4 of about 20-25 cm. At
Mullet Point she would catch 2-3 per hour. But since 2 years, the size
class she catches has disappeared. In fact, she hasn't caught a single
one in about 30-40 trips of 2-2.5 hours of fishing.
at the above three places.
The Snappers caught seem to be bigger (3.5 pounds, 40 cm) but with a
noticeable size gap between them and the undersized ones (less than 20cm).
Her partner agrees with her that the snapper are harder to catch ("The
fishing has dropped away"). It is felt that the Snapper haven't changed
suddenly but reduced in numbers gradually.
At Mullet Point the trevallys caught appear to be bigger. Kahawai suddenly
decreased about 2 years ago.
Margareth has also seen big fish in schools of 6-10, visit the upper
estuary along the oyster tiles. Amongst these tiles they would stand head
down, working the bottom, their yellow tails sticking out above the surface.
Since the water was about 1m deep, these fish must have measured between
80 and 120cm. When these fish swim horizontally, they show a big yellow
dorsal fin above the water. Apart from that, the fish are very shiny/silvery,
unlike kingfish. Their tails also appear broader than those of Kingfish.
For several years now she has observed them returning to the upper Mahurangi
in the month of February.
I suggested that these fish might have been samsonfish (Seriola hippos).
These are sideways compressed (unlike kingfish), up to 150cm long, silvery
with yellow fins and tail and they occur in small groups. Although they
are uncommon in our waters, they are occasionally seen.
Margareth Jarius; 295 Mahurangi East Rd; Snells Beach
 Between
October 1992 and December 1992 we have seen plankton blooms as never before
in the area around Leigh. Not many divers would have dived in those months
but we needed to set up the SEAFRIENDS saltwater aquariums and made many
dives to collect specimens. In November 1992 the blooms were so dense that
the amount of light at 20m depth was barely enough to distinguish between
the white sandy bottom and the dark, kelp covered, rock; even after 30
minutes of adjustment. In addition the water stayed unusually cool for
the year. Having had experience in transplanting seaweeds to our aquariums
and being familiar with the light levels they require, it was feared that
major damage would result to under water plants and for that reason to
the whole underwater community.
Between
October 1992 and December 1992 we have seen plankton blooms as never before
in the area around Leigh. Not many divers would have dived in those months
but we needed to set up the SEAFRIENDS saltwater aquariums and made many
dives to collect specimens. In November 1992 the blooms were so dense that
the amount of light at 20m depth was barely enough to distinguish between
the white sandy bottom and the dark, kelp covered, rock; even after 30
minutes of adjustment. In addition the water stayed unusually cool for
the year. Having had experience in transplanting seaweeds to our aquariums
and being familiar with the light levels they require, it was feared that
major damage would result to under water plants and for that reason to
the whole underwater community.
 In
this report we have brought together the data collected from 39 dives but
also observations and anecdotal evidence relating to the plankton blooms.
When reading this report, it is useful to know that the rocky shore in
this part of New Zealand is zoned, mainly because of wave exposure and
the availability of light:
In
this report we have brought together the data collected from 39 dives but
also observations and anecdotal evidence relating to the plankton blooms.
When reading this report, it is useful to know that the rocky shore in
this part of New Zealand is zoned, mainly because of wave exposure and
the availability of light:
 Water
temperature
Water
temperature
 Water
clarity
Water
clarity
 This
survey gave us a better understanding of how Ecklonia reacts to light starvation.
The diagram shows the story pictorially.
This
survey gave us a better understanding of how Ecklonia reacts to light starvation.
The diagram shows the story pictorially.

 The
effect of the plankton blooms on both Ancorina and Solanderia
was not clear-cut. The cluster diagram shows the abundance of both plotted
against the severity of the plankton bloom, as measured by the amount of
kelp death. The black dots are the places around the Colville Channel that
are affected by sedimentation (mud) and some current, whereas the blue
dots are where the kelpbed died twice. The graph appears to infer that
Ancorina
is a robust survivor, but dies when stressed by both mud and overly dense
plankton.
The
effect of the plankton blooms on both Ancorina and Solanderia
was not clear-cut. The cluster diagram shows the abundance of both plotted
against the severity of the plankton bloom, as measured by the amount of
kelp death. The black dots are the places around the Colville Channel that
are affected by sedimentation (mud) and some current, whereas the blue
dots are where the kelpbed died twice. The graph appears to infer that
Ancorina
is a robust survivor, but dies when stressed by both mud and overly dense
plankton.
 These
cluster diagrams depict possible effects of the dense plankton blooms
on other species. On left 0% kelp mortality and on right 100%. For the
white anemone (Actinothoe) the situation looks confusing until the
cluster coloured in blue at the top left is isolated, because these belong
to the sites that lost their kelpbed the year before, followed by population
explosions of these anemones. The yellow Polymastia sponge shows
a similar sensitivity but Tethya sponges appear to be more sensitive.
However, the situation with the bryozoa is not at all clear, whereas observations
have shown them to be quite sensitive to land-based pollution. Locations
bordering the Colville Channel (black dots) appear to have lost their bryozoa
before the event, whereas Arid Island (top left) retained some of its previously
very many bryozoa.
These
cluster diagrams depict possible effects of the dense plankton blooms
on other species. On left 0% kelp mortality and on right 100%. For the
white anemone (Actinothoe) the situation looks confusing until the
cluster coloured in blue at the top left is isolated, because these belong
to the sites that lost their kelpbed the year before, followed by population
explosions of these anemones. The yellow Polymastia sponge shows
a similar sensitivity but Tethya sponges appear to be more sensitive.
However, the situation with the bryozoa is not at all clear, whereas observations
have shown them to be quite sensitive to land-based pollution. Locations
bordering the Colville Channel (black dots) appear to have lost their bryozoa
before the event, whereas Arid Island (top left) retained some of its previously
very many bryozoa.
 Zoning
in relation to exposure.
Zoning
in relation to exposure.

 In
1983 also a dying specimen was found by Chris Battershill, near Leigh.
Although discoloured already, it showed what the live animal looked like.
In 1989, after studying the common heart urchin (Echinocardium australe),
we linked 'sink holes' found in the sand to the giant heart urchin. It
lives 20-40cm below the sand surface, rather than 3-5cm for the common
heart urchin (Echinocardium australe), and has therefore escaped
the attention of scientists. Digging a hole that deep (in order to catch
it), is rather cumbersome underwater because of the dust it causes and
because the hole keeps caving in. At the end one has to dislodge a large,
very prickly object, without damaging it. It was shown that the giant heart
urchin lived in their thousands right under the watchful eye of the scientific
community of the Leigh Laboratory! What is more, their diggings are rather
obtrusive and often half a metre across, and nobody had wondered what they
were!
In
1983 also a dying specimen was found by Chris Battershill, near Leigh.
Although discoloured already, it showed what the live animal looked like.
In 1989, after studying the common heart urchin (Echinocardium australe),
we linked 'sink holes' found in the sand to the giant heart urchin. It
lives 20-40cm below the sand surface, rather than 3-5cm for the common
heart urchin (Echinocardium australe), and has therefore escaped
the attention of scientists. Digging a hole that deep (in order to catch
it), is rather cumbersome underwater because of the dust it causes and
because the hole keeps caving in. At the end one has to dislodge a large,
very prickly object, without damaging it. It was shown that the giant heart
urchin lived in their thousands right under the watchful eye of the scientific
community of the Leigh Laboratory! What is more, their diggings are rather
obtrusive and often half a metre across, and nobody had wondered what they
were!
 Concentrations
of blue penguin were also found south of the Chicken Islands and in front
of Omaha Bay. In 2003, we found another concentration between Kawau Island
and Martins Bay (Feb 2003). We had the opportunity to re-do the penguin
transect between Little Barrier and Leigh, in February 2003, and found
only 3 penguins over a swath of 100 metres wide. No penguins were found
close to Little Barrier Island. It suggests that their numbers have declined
further in the decade since.
Concentrations
of blue penguin were also found south of the Chicken Islands and in front
of Omaha Bay. In 2003, we found another concentration between Kawau Island
and Martins Bay (Feb 2003). We had the opportunity to re-do the penguin
transect between Little Barrier and Leigh, in February 2003, and found
only 3 penguins over a swath of 100 metres wide. No penguins were found
close to Little Barrier Island. It suggests that their numbers have declined
further in the decade since.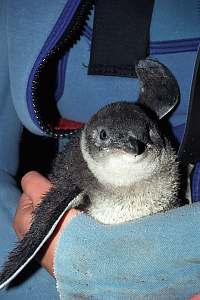